I wasn’t able to post my analysis on TradingView last week, so here’s a structured summary of my ticker reviews from Oct 6–10, segmented by sector with brief commentary. Each includes an update on trend structure and a link to both the original chart and the latest revision as of Friday’s close.
Technology
 AMD – Clean follow-through off mid-term support into the upper band of resistance. Strong rejection increases the odds that a mid-term top for the uptrend since April is being formed. Any lower-high formation next week should be approached with caution.
Chart:

Previously:
• Upside potential to resistance (Oct 7):

• Downside potential:
• On resistance & bounce potential (Aug 6):
• On macro resistance (Jul 29):
• On macro bottoming potential (Apr):
 NVTS – Followed the Aug–Sep setup and delivered a strong breakout Friday, but late-day reversal increases the odds of a longer consolidation into 7.80–6.80 support.
Chart:

Previously:
• Breakout and local support (Oct 10):
• Consolidation and upside potential (Sep 30):
• Higher-low potential (Sep 26):
• Mid-term support (Aug 25): tradingview.com/symbols/NASDAQ-NVTS/minds/?mind=TG-GkbRtRaGErSPSXMYcRg
 MRVL – Reached the key mid-term resistance zone outlined earlier. Friday’s rejection increases odds of a pullback into 80–72 support over the coming weeks.
Chart:

Previously:
• On mid-term top (Oct 10):
• On resistance zone (Oct 2): tradingview.com/symbols/NASDAQ-MRVL/minds/?mind=BTOV58OwQAS_gh52-D_Kvg
 WDC – Orderly follow-through to the downside into the 21 EMA.
Chart:

Previously: downside potential to 21 EMA –
 RBLX – Rejected at local resistance, aligning with the downside structure.
Chart:

Previously: downside potential (Oct 8):
 REKR – Shows strong relative strength with steady consolidation at support; constructive base-building continues.
Chart:

Previously: follow-through and support (Oct 7):
 AI – Friday breakout attempt faded back into support, increasing odds of prolonged base-building and a potential deeper pullback to 17–16.
Chart:
Previously:
On continuation potential (Oct 8):
 BB – Failed on immediate continuation and returned to support.
Chart:
Previously:
On continuation potential (Oct 8):
 OPEN – Constructive consolidation stalled as failed breakouts shifted odds toward a deeper pullback into mid-term support.
Chart:
⸻
Blockchain
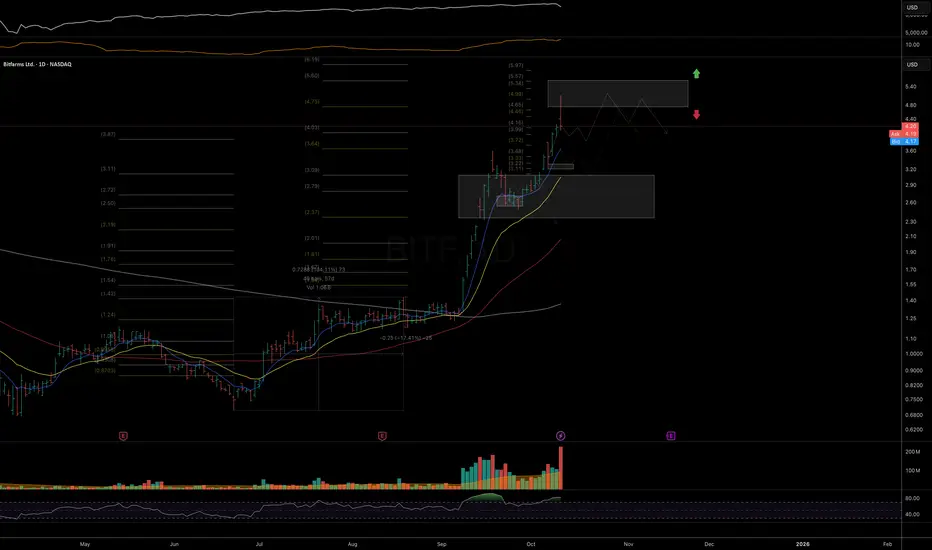
 BITF – Tagged the ideal macro resistance zone; odds rise for at least a mid-term top/base formation here.
Chart:

Previously:
On upside continuation (Oct 7):
 HIVE – Rejection at the top of mid-term resistance; probabilities favor the start of a reversal phase.
Chart:

Previously:
On macro resistance (Oct 6):
On more immediate upside potential (Sep 24): tradingview.com/symbols/NASDAQ-HIVE/minds/?mind=Vd571diiT1u3xVGH1kGhKw
•On bullish potential (Sep 10): tradingview.com/symbols/NASDAQ-HIVE/minds/?mind=UqHPKBdtQzCEipcKminPNQ
• On bullish trend structure (Jul 21): tradingview.com/symbols/NASDAQ-HIVE/minds/?mind=Y4zxqZwzRtyaDD8lmywGhw
 BKKT – No follow-through on continuation setup, but key local support still holds; structure remains intact while above it.
Chart:

Previously:
On continuation (Oct 9):
 BULL – Rotating back toward macro support near 11; monitoring for higher-low formation and reversal trigger.
Chart:

Previously:
On reversal and macro support (Oct 8):
On immediate bullish potential (Sep 26): tradingview.com/symbols/NASDAQ-BULL/minds/?mind=GqGeyQoBR6SKSPusscGaaA
• On macro support (Sep 19): tradingview.com/symbols/NASDAQ-BULL/minds/?mind=1zpzfLwhSNyk5xrc_bXRBg
• On macro support (Sep 4): tradingview.com/symbols/NASDAQ-BULL/minds/?mind=6lTB3WHIQAiRNPeDukZ1Wg&exchange=NASDAQ
• On mid-term resistance (Aug 6): tradingview.com/symbols/NASDAQ-BULL/minds/?mind=7SfNQ0fPQY2Zet6MU4KB6g&exchange=NASDAQ
• On support and bounce potential (Jul 30): tradingview.com/symbols/NASDAQ-BULL/minds/?mind=XQmtVEynRcu7Pye2Rw0E9Q&exchange=NASDAQ
 BTM – Bullish setup invalidated by breakdown into mid-term support.
Chart:

Previously:
On bullish follow-through if LOD holds (Oct 6):
⸻
Biotechnology / Healthcare
 VKTX – Strong follow-through from September update; watching for consolidation back into key EMAs to reset momentum.
Chart:

Previously:
On follow-through (Oct 6):
• On break-out potential (Sep 30): tradingview.com/symbols/NASDAQ-VKTX/minds/?mind=RyuxrFPaTMyJkFMZLAfOoQ
• On resistance zone (Aug 11): tradingview.com/symbols/NASDAQ-VKTX/minds/?mind=VLFAH1asTO2WJt4Y-TgXyw
• On upside momentum continuation (Jul 18): tradingview.com/symbols/NASDAQ-VKTX/minds/?mind=4owGJV5ZQaO33WP1hAviSg
• Original setup (Jun 30): tradingview.com/symbols/NASDAQ-VKTX/minds/?mind=Ug0UI_DXRAu5b95LGXIyog
• Follow-up (Jul 8): tradingview.com/symbols/NASDAQ-VKTX/minds/?mind=fZQV2wcyRL2hB7nariJikg
 NTLA – Clean follow-through into mid-term resistance; rising odds for a topping/base formation.
Chart:

Previously:
On break-out to resistance zone (Oct 8):
On support and bullish trend-structure (Sep 26): tradingview.com/symbols/NASDAQ-NTLA/minds/?mind=B8f6LFmoSxGopGgzEMnUPQ
 PGEN – Couldn’t stage a recovery yet but remains within mid-term support; stabilization needed for a constructive setup.
Chart:

Previously:
On potential reversal (Oct 8):
On mid-term support (Sep 15): tradingview.com/symbols/NASDAQ-PGEN/minds/?mind=Wd5W0WZ3R-qeB9zVjFAHHw
 ABCL – Momentum attempt resumed but failed to follow-through; still constructive above 21 EMA.
Chart:

Previously:
On local support and continuation potential (Oct 8):
On support and bullish trend-structure (Oct 7):
⸻
Energy
 GTE – Impulsive advance at risk of morphing into a diagonal correction; elevated probability of retesting September higher lows.
Chart:

Previously:
On constructive looking consolidation (Oct 6):

⸻
Miscellaneous / Other
 SLDP – Rising risk of a local top after Friday’s distribution; while above 21 EMA, a final push into resistance remains possible.
Chart:

Previously:
On follow-through and resistance zone (Oct 6):
On mid-term support and bullish potential (Sep 19): tradingview.com/symbols/NASDAQ-SLDP/minds/?mind=DStjOaOpSeGPWFwB-md_dA
 DPRO – Solid 2.5-day follow-through from the Oct update; Friday’s action suggests increased consolidation or reversal risk.
Chart:

Previously:
On local support and continuation (Oct 7):
 DLO – Disappointing fade after a promising start; must hold above 50-DMA to reassert upside momentum.
Chart:

Previously:
On break-out potential (Oct 8):
On pullback potential (Sep 22): tradingview.com/symbols/NASDAQ-DLO/minds/?mind=Zjk8an6VRFSLNP-Fdy3u7g
• On downside potential and support (Sep 3): tradingview.com/symbols/NASDAQ-DLO/minds/?mind=ceWeIiDKQ9-w4TabhWnsUw
Thank you for your attention and have a great start of the week!
Technology
Chart:
Previously:
• Upside potential to resistance (Oct 7):
• Downside potential:
• On resistance & bounce potential (Aug 6):
• On macro resistance (Jul 29):
• On macro bottoming potential (Apr):
Chart:
Previously:
• Breakout and local support (Oct 10):
• Consolidation and upside potential (Sep 30):
• Higher-low potential (Sep 26):
• Mid-term support (Aug 25): tradingview.com/symbols/NASDAQ-NVTS/minds/?mind=TG-GkbRtRaGErSPSXMYcRg
Chart:
Previously:
• On mid-term top (Oct 10):
• On resistance zone (Oct 2): tradingview.com/symbols/NASDAQ-MRVL/minds/?mind=BTOV58OwQAS_gh52-D_Kvg
Chart:
Previously: downside potential to 21 EMA –
Chart:
Previously: downside potential (Oct 8):
Chart:
Previously: follow-through and support (Oct 7):
Chart:
Previously:
On continuation potential (Oct 8):
Chart:
Previously:
On continuation potential (Oct 8):
Chart:
⸻
Blockchain
Chart:
Previously:
On upside continuation (Oct 7):
Chart:
Previously:
On macro resistance (Oct 6):
On more immediate upside potential (Sep 24): tradingview.com/symbols/NASDAQ-HIVE/minds/?mind=Vd571diiT1u3xVGH1kGhKw
•On bullish potential (Sep 10): tradingview.com/symbols/NASDAQ-HIVE/minds/?mind=UqHPKBdtQzCEipcKminPNQ
• On bullish trend structure (Jul 21): tradingview.com/symbols/NASDAQ-HIVE/minds/?mind=Y4zxqZwzRtyaDD8lmywGhw
Chart:
Previously:
On continuation (Oct 9):
Chart:
Previously:
On reversal and macro support (Oct 8):
On immediate bullish potential (Sep 26): tradingview.com/symbols/NASDAQ-BULL/minds/?mind=GqGeyQoBR6SKSPusscGaaA
• On macro support (Sep 19): tradingview.com/symbols/NASDAQ-BULL/minds/?mind=1zpzfLwhSNyk5xrc_bXRBg
• On macro support (Sep 4): tradingview.com/symbols/NASDAQ-BULL/minds/?mind=6lTB3WHIQAiRNPeDukZ1Wg&exchange=NASDAQ
• On mid-term resistance (Aug 6): tradingview.com/symbols/NASDAQ-BULL/minds/?mind=7SfNQ0fPQY2Zet6MU4KB6g&exchange=NASDAQ
• On support and bounce potential (Jul 30): tradingview.com/symbols/NASDAQ-BULL/minds/?mind=XQmtVEynRcu7Pye2Rw0E9Q&exchange=NASDAQ
Chart:
Previously:
On bullish follow-through if LOD holds (Oct 6):
⸻
Biotechnology / Healthcare
Chart:
Previously:
On follow-through (Oct 6):
• On break-out potential (Sep 30): tradingview.com/symbols/NASDAQ-VKTX/minds/?mind=RyuxrFPaTMyJkFMZLAfOoQ
• On resistance zone (Aug 11): tradingview.com/symbols/NASDAQ-VKTX/minds/?mind=VLFAH1asTO2WJt4Y-TgXyw
• On upside momentum continuation (Jul 18): tradingview.com/symbols/NASDAQ-VKTX/minds/?mind=4owGJV5ZQaO33WP1hAviSg
• Original setup (Jun 30): tradingview.com/symbols/NASDAQ-VKTX/minds/?mind=Ug0UI_DXRAu5b95LGXIyog
• Follow-up (Jul 8): tradingview.com/symbols/NASDAQ-VKTX/minds/?mind=fZQV2wcyRL2hB7nariJikg
Chart:
Previously:
On break-out to resistance zone (Oct 8):
On support and bullish trend-structure (Sep 26): tradingview.com/symbols/NASDAQ-NTLA/minds/?mind=B8f6LFmoSxGopGgzEMnUPQ
Chart:
Previously:
On potential reversal (Oct 8):
On mid-term support (Sep 15): tradingview.com/symbols/NASDAQ-PGEN/minds/?mind=Wd5W0WZ3R-qeB9zVjFAHHw
Chart:
Previously:
On local support and continuation potential (Oct 8):
On support and bullish trend-structure (Oct 7):
⸻
Energy
Chart:
Previously:
On constructive looking consolidation (Oct 6):
⸻
Miscellaneous / Other
Chart:
Previously:
On follow-through and resistance zone (Oct 6):
On mid-term support and bullish potential (Sep 19): tradingview.com/symbols/NASDAQ-SLDP/minds/?mind=DStjOaOpSeGPWFwB-md_dA
Chart:
Previously:
On local support and continuation (Oct 7):
Chart:
Previously:
On break-out potential (Oct 8):
On pullback potential (Sep 22): tradingview.com/symbols/NASDAQ-DLO/minds/?mind=Zjk8an6VRFSLNP-Fdy3u7g
• On downside potential and support (Sep 3): tradingview.com/symbols/NASDAQ-DLO/minds/?mind=ceWeIiDKQ9-w4TabhWnsUw
Thank you for your attention and have a great start of the week!
📊 Daily FREE Market Insights | Crypto + US Stocks
⚡ Technical analysis, setups & commentary
🌍 t.me/MarketArtistryENG | 🇷🇺 t.me/marketartistry
⚡ Technical analysis, setups & commentary
🌍 t.me/MarketArtistryENG | 🇷🇺 t.me/marketartistry
إخلاء المسؤولية
لا يُقصد بالمعلومات والمنشورات أن تكون، أو تشكل، أي نصيحة مالية أو استثمارية أو تجارية أو أنواع أخرى من النصائح أو التوصيات المقدمة أو المعتمدة من TradingView. اقرأ المزيد في شروط الاستخدام.