Bitcoin (BTC/USDT) – Full Technical Breakdown - Timeframe: 1D
Market Structure & SMC (Smart Money Concepts)
✅ CHoCH (Change of Character) confirmed from $105K top → current lower high around 88K zone.
📉 Break of Structure (BOS) to the downside occurred at $91K.
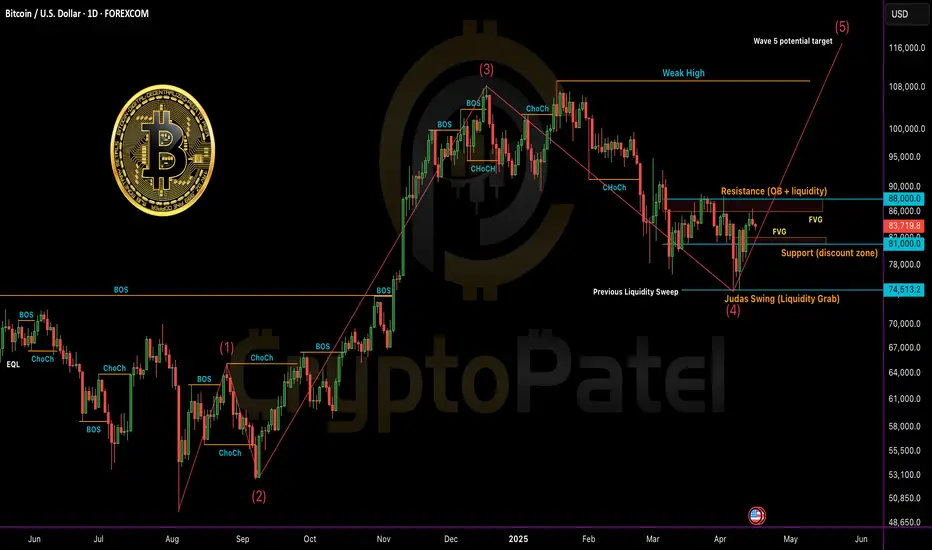
🟠 Bearish Order Block (OB): $86K–88K (price currently reacting here).
Liquidity Levels:
Sell-side: Swept at $76K
Buy-side: Sitting above88K
Fair Value Gap (FVG): Unfilled zone between $81K– 82K may act as magnet for price.
ICT Model Alignment
Judas Swing: Sharp liquidity grab below $76K → followed by rebound — classic manipulation before real move.
PD Array Setup:
Resistance:88K (bearish OB + buy-side liquidity)
Support: $81K (discount zone + FVG)
Elliott Wave Outlook
Wave 1: July–Sept 2024
Wave 3: Nov–Feb rally to $105K (extended wave)
Wave 4: Correction to $76K likely complete
Wave 5 Target: Potential $115K+ if structure holds
Fractal Observation
🔹 Current price structure is mimicking Nov 2023–Jan 2024 pattern
🔹 If history rhymes: consolidation → breakout → retest → parabolic rally
Key Levels to Watch
🔼 Bullish Confirmation: Daily close above88K → targeting  92K–$100K
🔽 Bearish Rejection: Drop below $81K → next support at $74K–$76K
Strategy Summary
🔹 Short-Term Bias: Cautiously Bullish
🔹 Entry Zone: Retest near82K (FVG + OB)
🔹 SL: Below $79.5K
🔹 TP Zones:88K → 92K →  98K
98K
📈 R:R = Minimum 1:5 (High confluence)
Keep your eyes on HTF closures and manage risk. Liquidity traps are in play.
Market Structure & SMC (Smart Money Concepts)
✅ CHoCH (Change of Character) confirmed from $105K top → current lower high around
📉 Break of Structure (BOS) to the downside occurred at $91K.
🟠 Bearish Order Block (OB): $86K–
Liquidity Levels:
Sell-side: Swept at $76K
Buy-side: Sitting above
Fair Value Gap (FVG): Unfilled zone between $81K–
ICT Model Alignment
Judas Swing: Sharp liquidity grab below $76K → followed by rebound — classic manipulation before real move.
PD Array Setup:
Resistance:
Support: $81K (discount zone + FVG)
Elliott Wave Outlook
Wave 1: July–Sept 2024
Wave 3: Nov–Feb rally to $105K (extended wave)
Wave 4: Correction to $76K likely complete
Wave 5 Target: Potential $115K+ if structure holds
Fractal Observation
🔹 Current price structure is mimicking Nov 2023–Jan 2024 pattern
🔹 If history rhymes: consolidation → breakout → retest → parabolic rally
Key Levels to Watch
🔼 Bullish Confirmation: Daily close above
🔽 Bearish Rejection: Drop below $81K → next support at $74K–$76K
Strategy Summary
🔹 Short-Term Bias: Cautiously Bullish
🔹 Entry Zone: Retest near
🔹 SL: Below $79.5K
🔹 TP Zones:
📈 R:R = Minimum 1:5 (High confluence)
Keep your eyes on HTF closures and manage risk. Liquidity traps are in play.
Twitter: twitter.com/CryptoPatel
Telegram: t.me/OfficialCryptoPatel
Instagram: instagram.com/cryptopatel?utm_medium=copy_link
Telegram: t.me/OfficialCryptoPatel
Instagram: instagram.com/cryptopatel?utm_medium=copy_link
إخلاء المسؤولية
لا يُقصد بالمعلومات والمنشورات أن تكون، أو تشكل، أي نصيحة مالية أو استثمارية أو تجارية أو أنواع أخرى من النصائح أو التوصيات المقدمة أو المعتمدة من TradingView. اقرأ المزيد في شروط الاستخدام.