📉 BTCUSDT – Wave 5 Completed, Correction in Progress!
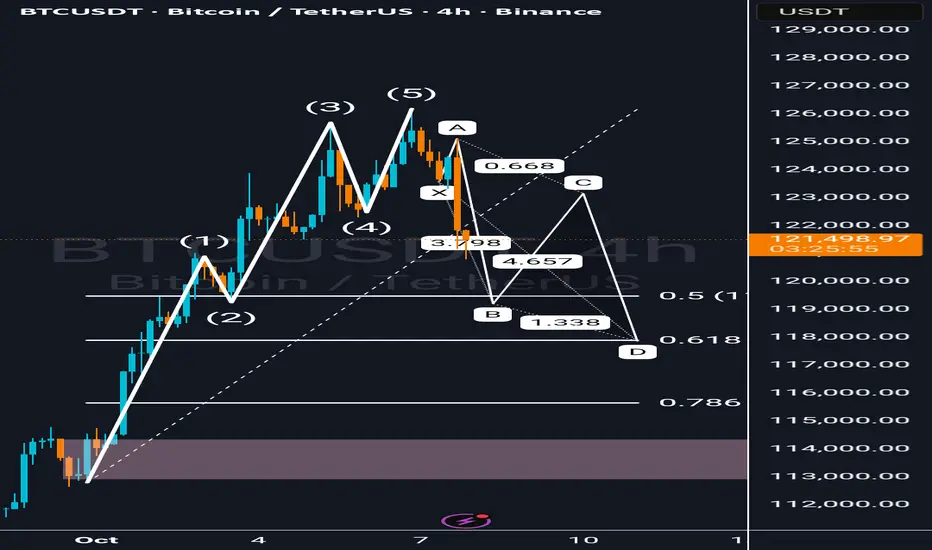
After completing a clear Elliott Wave impulse (1–5), Bitcoin now appears to be entering a complex corrective phase.
The chart shows an emerging ABC pattern that may align with a harmonic XA–BC–D structure, with key Fibonacci confluence zones around:
0.5 retracement: 119,484
0.618 retracement: 117,900
Potential Wave D target: 117K–118K
This correction could offer a buy-the-dip opportunity if BTC holds above the Fibonacci support and shows a strong bullish reaction.
However, if Wave D breaks below the 0.786 zone (around 115K), selling pressure could extend toward the 1.272 extension (around 109K).
📊 Short-term traders: Watch price reactions near 119K–118K.
📈 Long-term investors: Wait for a confirmed reversal signal before entering.
---
💬 What do you think? Is this just a healthy pullback before the next impulsive wave, or the start of a deeper correction?
#BTCUSDT #Bitcoin #ElliottWave #CryptoAnalysis #TradingView
إخلاء المسؤولية
لا يُقصد بالمعلومات والمنشورات أن تكون، أو تشكل، أي نصيحة مالية أو استثمارية أو تجارية أو أنواع أخرى من النصائح أو التوصيات المقدمة أو المعتمدة من TradingView. اقرأ المزيد في شروط الاستخدام.
إخلاء المسؤولية
لا يُقصد بالمعلومات والمنشورات أن تكون، أو تشكل، أي نصيحة مالية أو استثمارية أو تجارية أو أنواع أخرى من النصائح أو التوصيات المقدمة أو المعتمدة من TradingView. اقرأ المزيد في شروط الاستخدام.