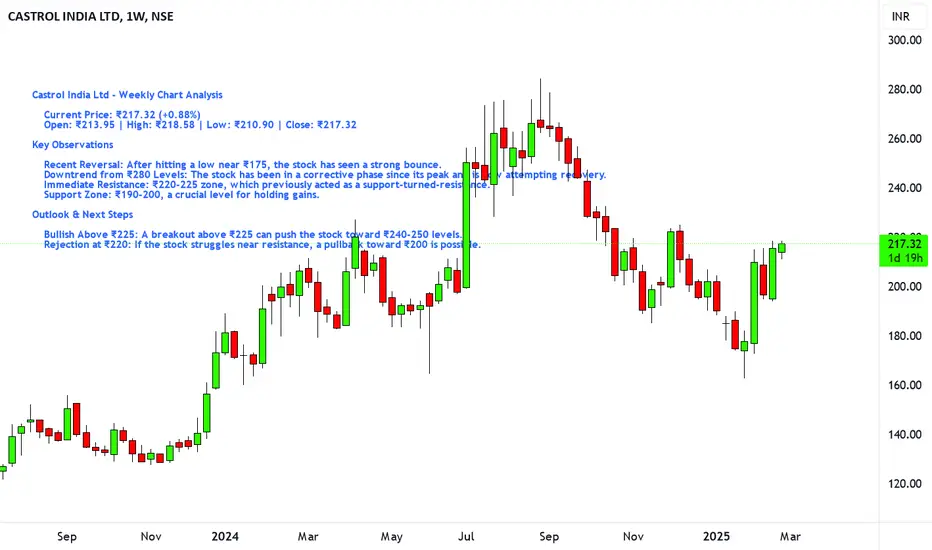
Castrol India Ltd - Weekly Chart Analysis
Current Price: ₹217.32 (+0.88%)
Open: ₹213.95 | High: ₹218.58 | Low: ₹210.90 | Close: ₹217.32
Key Observations
Recent Reversal: After hitting a low near ₹175, the stock has seen a strong bounce.
Downtrend from ₹280 Levels: The stock has been in a corrective phase since its peak and is now attempting recovery.
Immediate Resistance: ₹220-225 zone, which previously acted as a support-turned-resistance.
Support Zone: ₹190-200, a crucial level for holding gains.
Outlook & Next Steps
Bullish Above ₹225: A breakout above ₹225 can push the stock toward ₹240-250 levels.
Rejection at ₹220: If the stock struggles near resistance, a pullback toward ₹200 is possible.
Automated Tools/Indicators/Screeners available at kkonline.org/nimblrta
إخلاء المسؤولية
لا يُقصد بالمعلومات والمنشورات أن تكون، أو تشكل، أي نصيحة مالية أو استثمارية أو تجارية أو أنواع أخرى من النصائح أو التوصيات المقدمة أو المعتمدة من TradingView. اقرأ المزيد في شروط الاستخدام.
Automated Tools/Indicators/Screeners available at kkonline.org/nimblrta
إخلاء المسؤولية
لا يُقصد بالمعلومات والمنشورات أن تكون، أو تشكل، أي نصيحة مالية أو استثمارية أو تجارية أو أنواع أخرى من النصائح أو التوصيات المقدمة أو المعتمدة من TradingView. اقرأ المزيد في شروط الاستخدام.