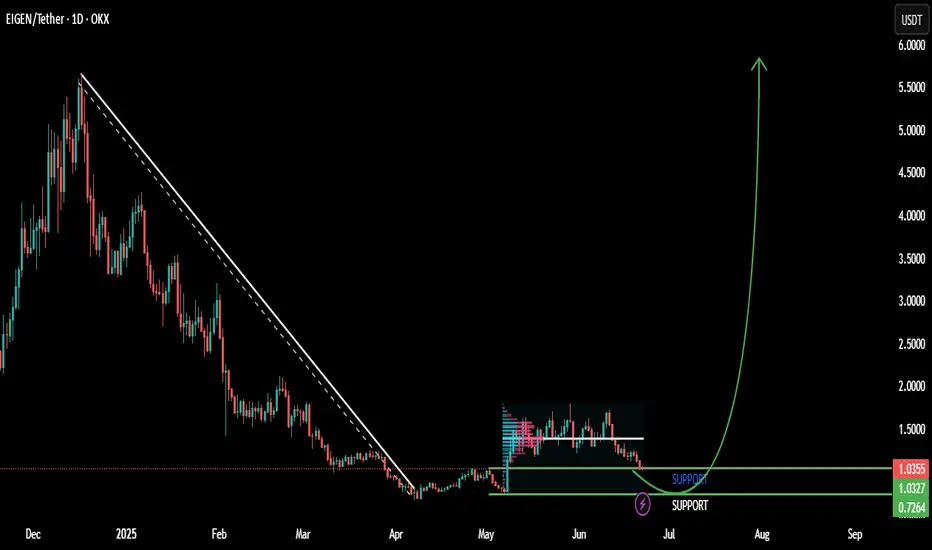
Historical Trend: The chart shows the price movement of Eigen / Tether (EIGEN/USDT) on a 1-day timeframe from November 2024 to June 2025. The price followed a prolonged downtrend, defined by a descending trendline, from late 2024 until a recent reversal.
Key Levels:
Support: The $1.034 and $0.761 levels (green lines) have acted as significant support zones. The price recently bounced from around $0.761, indicating strong buying interest at this level.
Resistance: The upward projection (green arrow) suggests potential resistance around $6,000, though no specific resistance line is marked yet.
Recent Price Action: After hitting a low near $0.761 in mid-2025, the price broke above the downtrend line, signaling a potential trend reversal. This breakout was followed by a sharp upward move, suggesting a shift to bullish momentum.
Projected Movement: The upward projection indicates the price could target levels as high as $6,000 if the bullish trend continues. The initial support at $1.034 and $0.761 will be critical to hold to sustain this momentum.
Volume and Indicators: The chart includes Bollinger Bands (O1.0362 H1.0591 L1.014 C1.0304) with a -0.0047 (-0.45%) change, indicating low volatility at the recent low. The breakout suggests increasing buying volume, though specific volume data is not detailed.
Outlook: The trend line breakout and sharp upward move indicate a strong bullish reversal. Maintaining above $1.034 is key for the uptrend to continue. A failure to hold this level could see the price retest $0.761 support. Watch for confirmation of sustained momentum toward higher resistance levels.
إخلاء المسؤولية
لا يُقصد بالمعلومات والمنشورات أن تكون، أو تشكل، أي نصيحة مالية أو استثمارية أو تجارية أو أنواع أخرى من النصائح أو التوصيات المقدمة أو المعتمدة من TradingView. اقرأ المزيد في شروط الاستخدام.
إخلاء المسؤولية
لا يُقصد بالمعلومات والمنشورات أن تكون، أو تشكل، أي نصيحة مالية أو استثمارية أو تجارية أو أنواع أخرى من النصائح أو التوصيات المقدمة أو المعتمدة من TradingView. اقرأ المزيد في شروط الاستخدام.