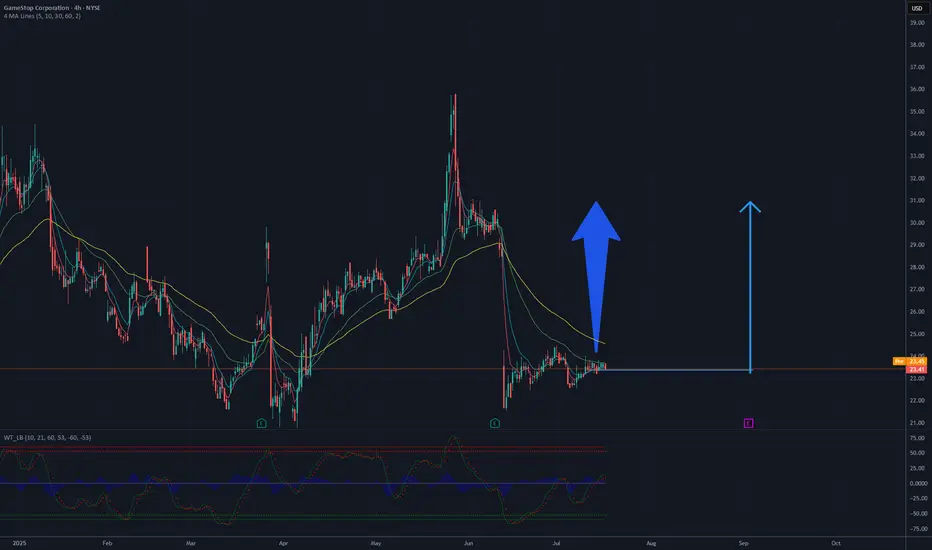
Analysis of the GameStop (GME) chart suggests a potential rise to 30 USD, based on current trends and technical levels. The 4-hour chart shows a recent decline following a sharp increase, with the price currently fluctuating around 23-24 USD. Key support is located at approximately 22 USD, which could act as a floor if the price starts to drop. The moving averages (e.g., 50-day and 200-day) indicate a previous upward trend, and current levels may represent a consolidation phase before the next upward move.
Breaking through resistance around 25-26 USD, which aligns with a previous peak, could pave the way for further growth. If demand increases and trading volume rises, the price could head toward 30 USD, a psychological and technical resistance level. Additional bullish signals, such as green candles or an increase in the oscillator (e.g., RSI) from current levels, could support this scenario. However, the risk of a sudden reversal should be monitored, especially if support at 22 USD is breached.
Potential TP: 30 USD
إخلاء المسؤولية
لا يُقصد بالمعلومات والمنشورات أن تكون، أو تشكل، أي نصيحة مالية أو استثمارية أو تجارية أو أنواع أخرى من النصائح أو التوصيات المقدمة أو المعتمدة من TradingView. اقرأ المزيد في شروط الاستخدام.
إخلاء المسؤولية
لا يُقصد بالمعلومات والمنشورات أن تكون، أو تشكل، أي نصيحة مالية أو استثمارية أو تجارية أو أنواع أخرى من النصائح أو التوصيات المقدمة أو المعتمدة من TradingView. اقرأ المزيد في شروط الاستخدام.