Trend
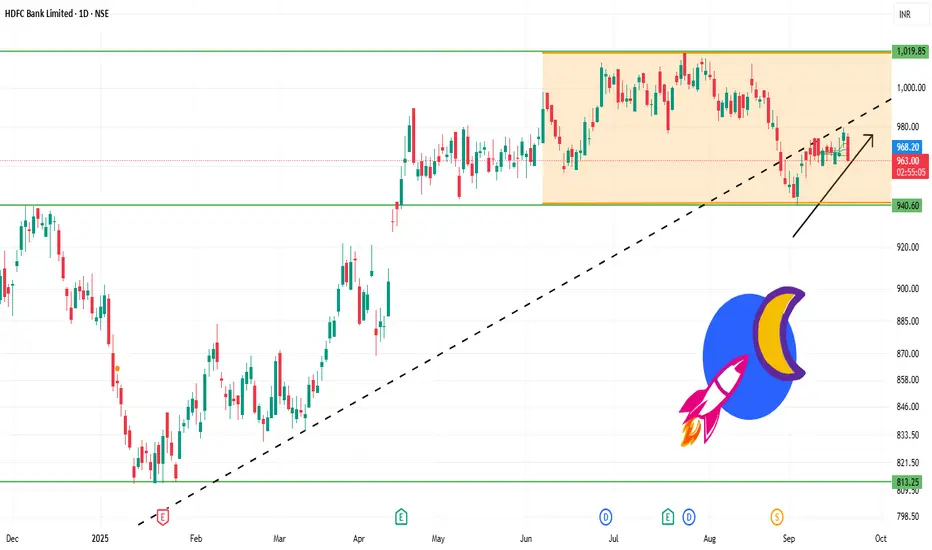
Trading around ₹967 – ₹970.
Stock is in a consolidation phase for the past few months.
Long-term trend is intact since it is above the 200-day moving average.
Support Levels
₹960 – ₹965 → immediate support zone.
₹945 – ₹950 → stronger support; if this breaks, stock may weaken further.
Resistance Levels
₹970 – ₹975 → immediate resistance; stock is struggling to cross this area.
₹980 – ₹992 → next major resistance; breakout above this could open path to ₹1,020.
Indicators
RSI near 55 → neutral to mildly bullish, not overbought.
MACD positive, showing some upward momentum.
Short-term moving averages are mixed, but long-term support remains strong.
Price Action
Range-bound between ₹960 – ₹975.
Breakout or breakdown from this range will decide the next trend.
✅ Facts & Insights
Fact 1: Above ₹975, HDFC Bank can rally towards ₹980 – ₹992 and possibly ₹1,020.
Fact 2: Below ₹960, stock may slip to ₹945 – ₹950, and deeper to ₹920 – ₹900 if weakness continues.
Fact 3: Long-term outlook remains positive, but short-term is sideways until a breakout.
منشورات ذات صلة
إخلاء المسؤولية
لا يُقصد بالمعلومات والمنشورات أن تكون، أو تشكل، أي نصيحة مالية أو استثمارية أو تجارية أو أنواع أخرى من النصائح أو التوصيات المقدمة أو المعتمدة من TradingView. اقرأ المزيد في شروط الاستخدام.
منشورات ذات صلة
إخلاء المسؤولية
لا يُقصد بالمعلومات والمنشورات أن تكون، أو تشكل، أي نصيحة مالية أو استثمارية أو تجارية أو أنواع أخرى من النصائح أو التوصيات المقدمة أو المعتمدة من TradingView. اقرأ المزيد في شروط الاستخدام.