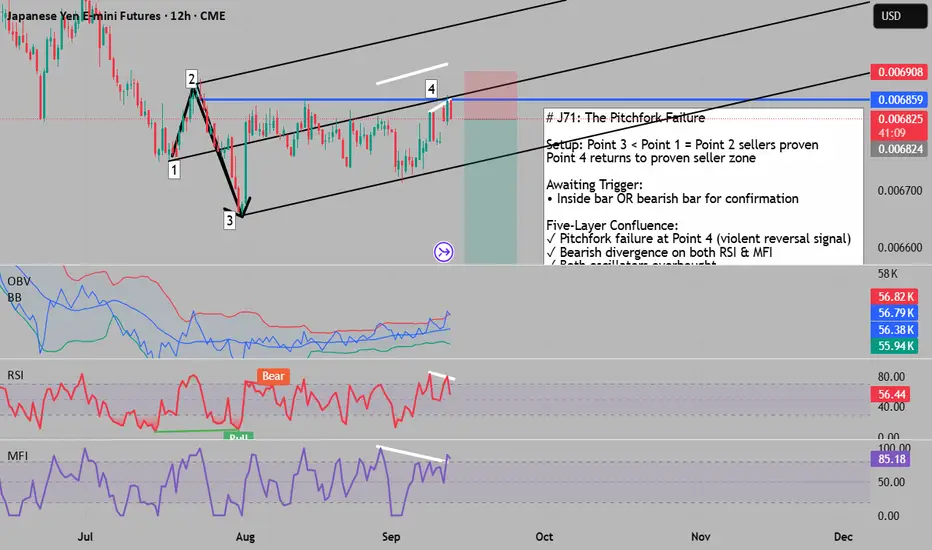
# The Pitchfork Failure: J71's Breakdown Signal
## Proven Sellers Established (Points 1→3)
When Point 3 decisively closed below Point 1, the market delivered its verdict: Point 2 sellers are the dominant force. This isn't speculation - it's market-proven fact. These sellers didn't just push price lower; they established themselves as the controlling participants who will likely defend their territory when tested.
Point 4 marks that critical test - price has returned to these proven sellers' domain, setting up what could be a decisive rejection.
## The Pitchfork Failure Phenomenon
Using Andrews Pitchfork on Points 1, 2, and 3 reveals something crucial: Point 4 shows a failure to follow through within the pitchfork structure. In pitchfork theory, when price fails to respect the channel and shows weakness at a median line, it often signals an impending violent reversal in the opposite direction.
This isn't just a touch of resistance - it's a structural failure that suggests the attempted recovery lacks the momentum to continue.
## The Waiting Game: Confirmation Triggers
Currently awaiting one of two catalysts:
• Inside bar: Shows indecision at resistance, often preceding directional moves
• Bearish bar: Direct confirmation of seller presence
This patience for the right setup separates professional trading from gambling. The setup is loaded; we're simply waiting for the trigger.
## Five-Layer Technical Confluence
1. Divergence Double Play
• RSI: Bearish divergence (price higher, RSI lower)
• MFI: Bearish divergence (price higher, MFI lower)
Both momentum indicators reveal exhaustion beneath the surface.
2. Overbought Extremes
• RSI: Overbought territory
• MFI: Overbought territory
Classic reversal conditions when combined with divergence.
3. OBV Historical Pattern
The OBV shows a similar spike at the upper border as seen at the Point 2 pivot. When volume patterns repeat at similar price levels, it suggests algorithmic or institutional behavior - and they're distributing, not accumulating.
4. VWAP Failure Signal
If price closes below the 1st VWAP standard deviation, it signals:
• Failure to reach the 2nd deviation (bearish)
• Increasing downward pressure
• Mean reversion beginning
5. Structural Resistance
Return to proven seller territory (Point 2 level) where supply previously overwhelmed demand.
## The Institutional Tell
The OBV pattern matching between Point 2 and Point 4 deserves special attention. When volume signatures repeat at resistance levels, it often indicates institutional distribution patterns. Large players leave footprints in volume that retail can't replicate. This similarity suggests the same sellers are active again.
## Risk Management Protocol
Entry Conditions:
• Inside bar completion OR
• Bearish candle confirmation OR
• Close below 1st VWAP deviation
Stop Loss: Above Point 2 (proven seller level)
Targets:
• T1: VWAP mean reversion
• T2: Pitchfork median line (if broken, accelerates down)
• T3: Point 3 support / Pitchfork lower boundary
## The Technical Narrative
The Yen's current position tells a clear story:
1. Sellers proved dominance (Points 1-3)
2. Price returns to test their resolve (Point 4)
3. Multiple indicators show exhaustion
4. Pitchfork structure failing
5. Volume patterns match previous distribution
When five independent analytical methods align with a structural failure pattern, probability heavily favors the short side.
---
Critical Insight: The pitchfork failure combined with repeating OBV patterns suggests this isn't just resistance - it's active distribution. The patient trader waits for confirmation, then strikes with conviction backed by multiple technical edges.
for trading mentorship and community, message me on telegram : jacesabr_real
إخلاء المسؤولية
لا يُقصد بالمعلومات والمنشورات أن تكون، أو تشكل، أي نصيحة مالية أو استثمارية أو تجارية أو أنواع أخرى من النصائح أو التوصيات المقدمة أو المعتمدة من TradingView. اقرأ المزيد في شروط الاستخدام.
for trading mentorship and community, message me on telegram : jacesabr_real
إخلاء المسؤولية
لا يُقصد بالمعلومات والمنشورات أن تكون، أو تشكل، أي نصيحة مالية أو استثمارية أو تجارية أو أنواع أخرى من النصائح أو التوصيات المقدمة أو المعتمدة من TradingView. اقرأ المزيد في شروط الاستخدام.