📊 Current Snapshot (as of right now)
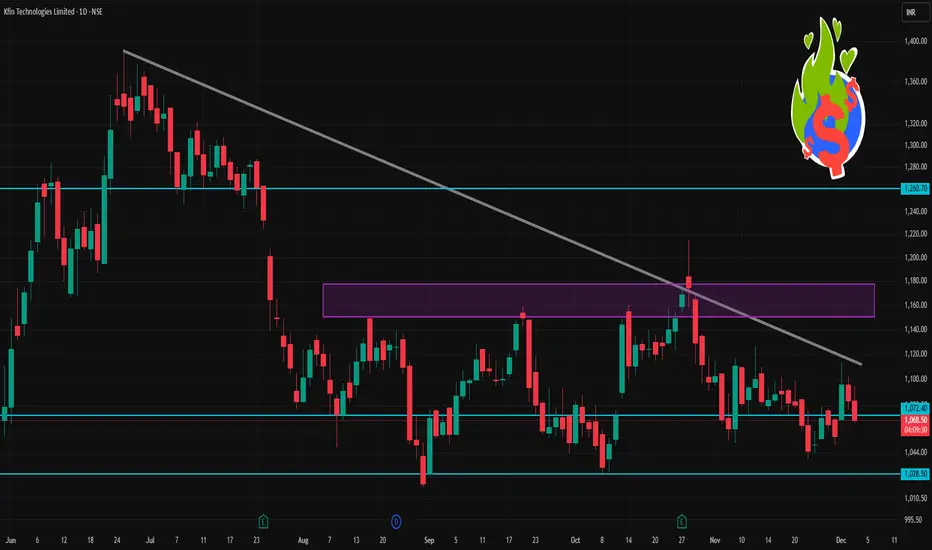
Reported day’s trading‑range so far: ~ ₹ 1,066.70 (low) to ~ ₹ 1,095.00 (high)
Opening price: ~ ₹ 1,083.80
Previous close: ~ ₹ 1,083.40
Market‑wide context: 52‑week high ~ ₹ 1,641.35, 52‑week low ~ ₹ 784.15
📌 Key Intraday / Short‑Term Levels (Classic Pivot‑Style)
Using the standard pivot‑point formula (Pivot = (High + Low + Close)/3) plus support/resistance calculations.
Here’s what that yields roughly for today — with High = 1,095.00, Low = 1,066.70, Close (yesterday) ≈ 1,083.40:
Level Approximate Price (₹)
Pivot (PP) ~ 1,081.70
Support 1 (S1) ~ 1,068.40
Support 2 (S2) ~ 1,050.40
Resistance 1 (R1) ~ 1,108.90
Resistance 2 (R2) ~ 1,131.00
Interpretation:
If the price stays above PP (~1,082) — bullish bias; otherwise, cautious/bearish.
S1 (~1,068) may act as “first floor”: if price drops near there and holds, watch for bounce.
A break below S2 (~1,050) might lead to deeper correction or volatility.
On upside, a strong move above R1 (~1,109) could challenge R2 (~1,131).
منشورات ذات صلة
إخلاء المسؤولية
لا يُقصد بالمعلومات والمنشورات أن تكون، أو تشكل، أي نصيحة مالية أو استثمارية أو تجارية أو أنواع أخرى من النصائح أو التوصيات المقدمة أو المعتمدة من TradingView. اقرأ المزيد في شروط الاستخدام.
منشورات ذات صلة
إخلاء المسؤولية
لا يُقصد بالمعلومات والمنشورات أن تكون، أو تشكل، أي نصيحة مالية أو استثمارية أو تجارية أو أنواع أخرى من النصائح أو التوصيات المقدمة أو المعتمدة من TradingView. اقرأ المزيد في شروط الاستخدام.