## 📊 **LTTS Daily Chart Analysis**
### 🧩 **Price Structure Overview**
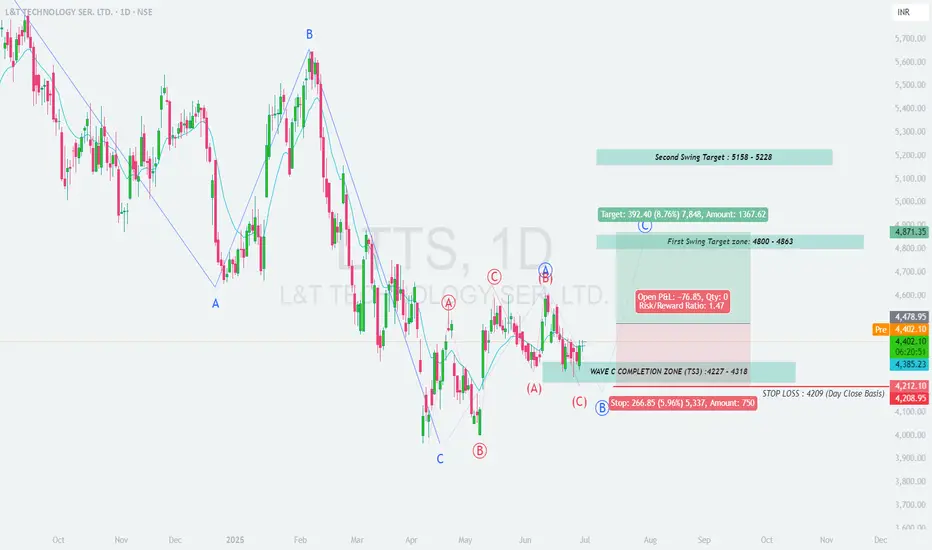
* The chart shows a completed **ABC correction** pattern.
* Price has recently bounced from a key \support demand zone\, marked by the blue and yellow boxes.
* A bullish wave structure is potentially forming, indicating trend reversal.
---
## 📉 **Support Zones**
* 📌 \Primary Support Zone:\ ₹4280–₹4320 (yellow box)
* 📌 \Structure Support (TS3 \[W3]):\ \~₹4225
Price recently reacted from these support areas with higher lows, hinting at buying interest and strength building.
---
## 📈 **Immediate Resistance / Supply Zones**
* 🟨 \Minor Resistance Zone:\ ₹4620–₹4700 (yellow box)
* 🟦 \Primary Resistance Zone / Target 1:\ ₹4800–₹4863
* 🟩 \Extended Upside Target Zone:\ ₹5450–₹5650 (green box)
---
## 📝 **Trade Idea: Positional Long**
### ✅ \Entry:\
* Around CMP (₹4405) or on dips towards ₹4300–₹4320 with bullish confirmation.
### 🎯 \Targets:\
* \T1:\ ₹4620
* \T2:\ ₹4800–₹4863
* \T3 (Extended):\ ₹5450–₹5650 (if trend sustains)
### ❌ \Stop Loss:\
* Daily close below \₹4225\ (below TS3 low)
---
## 🧠 **Trade Logic & Strategy**
* Price has respected the support zones and formed a possible reversal structure.
* If the stock breaks above the ₹4620–₹4700 zone, it can accelerate toward the ₹4800+ levels.
* Conservative traders can enter after a daily close above ₹4620.
---
## 📌 **Conclusion**
LTTS is setting up for a potential **bullish swing move**.
A structure-based entry near support with defined SL offers a favorable **risk-to-reward** setup for positional traders.
إخلاء المسؤولية
لا يُقصد بالمعلومات والمنشورات أن تكون، أو تشكل، أي نصيحة مالية أو استثمارية أو تجارية أو أنواع أخرى من النصائح أو التوصيات المقدمة أو المعتمدة من TradingView. اقرأ المزيد في شروط الاستخدام.
إخلاء المسؤولية
لا يُقصد بالمعلومات والمنشورات أن تكون، أو تشكل، أي نصيحة مالية أو استثمارية أو تجارية أو أنواع أخرى من النصائح أو التوصيات المقدمة أو المعتمدة من TradingView. اقرأ المزيد في شروط الاستخدام.