📊 Monthly Support & Resistance Levels
Based on pivot point analysis, here are the key levels to watch:
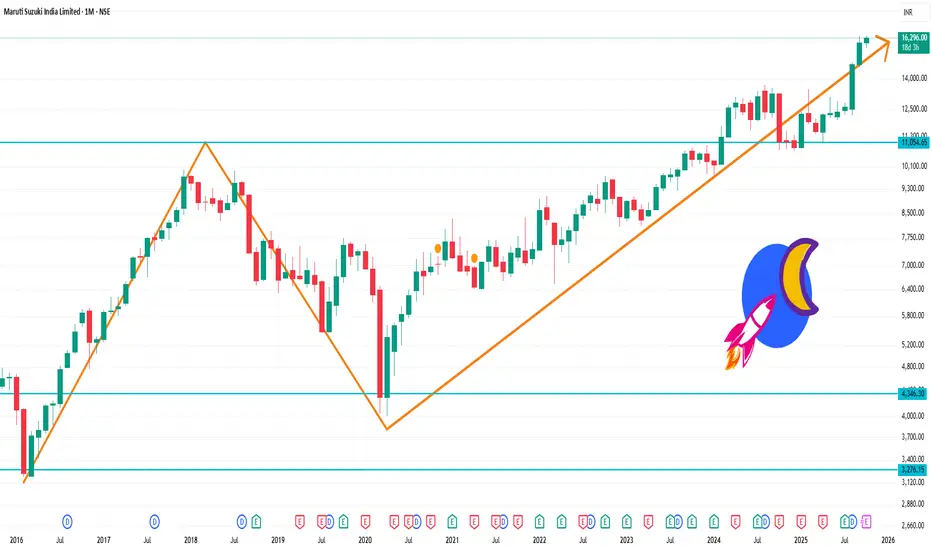
Pivot Point (PP): ₹16,163.67
Resistance Levels: ₹16,416.33 (R1), ₹16,567.67 (R2), ₹16,820.33 (R3)
Support Levels: ₹16,012.33 (S1), ₹15,759.67 (S2), ₹15,608.33 (S3)
These levels are derived from standard pivot point calculations and can serve as potential entry or exit points for traders.
Technical Indicators
Relative Strength Index (RSI): Currently at 59.15, indicating that the stock is not yet overbought and may have room for further upside.
Moving Averages: The stock is trading above its 50-day and 200-day moving averages, confirming an uptrend.
MACD: The Moving Average Convergence Divergence (MACD) is positive, suggesting bullish momentum.
Based on pivot point analysis, here are the key levels to watch:
Pivot Point (PP): ₹16,163.67
Resistance Levels: ₹16,416.33 (R1), ₹16,567.67 (R2), ₹16,820.33 (R3)
Support Levels: ₹16,012.33 (S1), ₹15,759.67 (S2), ₹15,608.33 (S3)
These levels are derived from standard pivot point calculations and can serve as potential entry or exit points for traders.
Technical Indicators
Relative Strength Index (RSI): Currently at 59.15, indicating that the stock is not yet overbought and may have room for further upside.
Moving Averages: The stock is trading above its 50-day and 200-day moving averages, confirming an uptrend.
MACD: The Moving Average Convergence Divergence (MACD) is positive, suggesting bullish momentum.
منشورات ذات صلة
إخلاء المسؤولية
The information and publications are not meant to be, and do not constitute, financial, investment, trading, or other types of advice or recommendations supplied or endorsed by TradingView. Read more in the Terms of Use.
منشورات ذات صلة
إخلاء المسؤولية
The information and publications are not meant to be, and do not constitute, financial, investment, trading, or other types of advice or recommendations supplied or endorsed by TradingView. Read more in the Terms of Use.