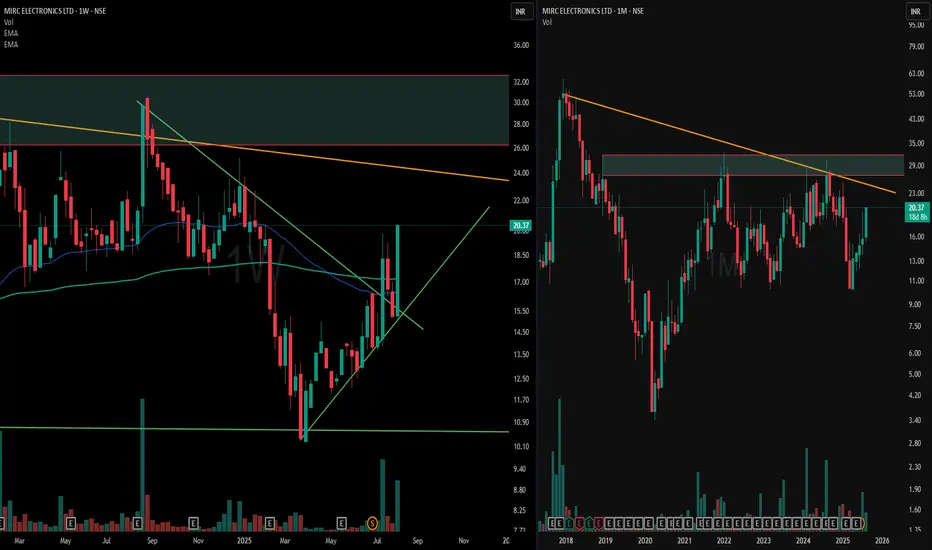
📊 Left Chart – Weekly Timeframe (WTF)
Price shifted from a series of lower highs/lows to forming a W-bottom entirely below the 200 & 50 EMA. Post-recovery, it moved into a channel consolidation, held by a green ascending support and capped by a green counter-trendline, creating a clean geometric structure.
📈 Right Chart – Monthly Timeframe (MTF)
A broader view reveals multi-fold hindrances, with red & orange trendlines marking a multi-year counter-trend. Each upside push faces historical resistance near the supply zone.
📝 Editorial Note:
Not a forecast — simply a snapshot of evolving structure from compressed weekly action to obstacle-heavy monthly context.
🎯 Master My Self-Made Trading Strategy
📈 Telegram (Learn Today): t.me/hashtaghammer
✅ WhatsApp (Learn Today): wa.me/919455664601
📈 Telegram (Learn Today): t.me/hashtaghammer
✅ WhatsApp (Learn Today): wa.me/919455664601
منشورات ذات صلة
إخلاء المسؤولية
لا يُقصد بالمعلومات والمنشورات أن تكون، أو تشكل، أي نصيحة مالية أو استثمارية أو تجارية أو أنواع أخرى من النصائح أو التوصيات المقدمة أو المعتمدة من TradingView. اقرأ المزيد في شروط الاستخدام.