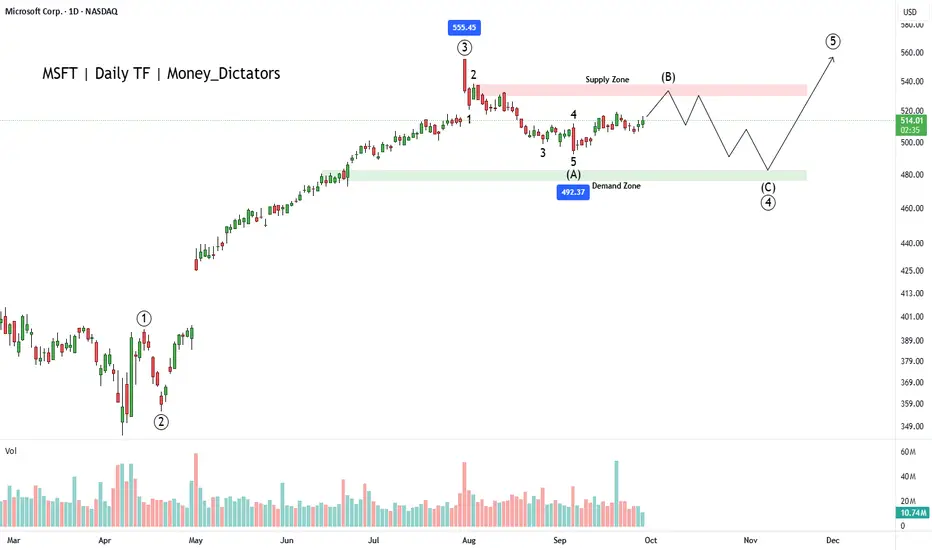
MSFT has bullish signals from the multiple moving averages, RSI and volume analysis. However, wave principle asks evidence from the buyers. The wave count suggests that the corrective wave (B) is ongoing, and bears will control the final wave of the primary wave 3.
Wave C will start falling nearby the supply zone and high of the 2nd wave of wave intermediate wave A. Wave C can fall up to 476 which will be the strength for wave primary wave 5. As per the chart, breakout above 540 will be a good signal for bulls to take charge back.
Zones:
Supply zone: 538 - 528
Demand zone: 482 - 476
I will update the chart and details shortly.
To eliminate these delays and give priority access to serious traders, we’ve launched an exclusive Premium EDU + Wave Count Group.
💰 Annual Fee: $115
BUY NOW: t.me/moneydictators/148
Lifetime Free - t.me/moneydictators
💰 Annual Fee: $115
BUY NOW: t.me/moneydictators/148
Lifetime Free - t.me/moneydictators
منشورات ذات صلة
إخلاء المسؤولية
لا يُقصد بالمعلومات والمنشورات أن تكون، أو تشكل، أي نصيحة مالية أو استثمارية أو تجارية أو أنواع أخرى من النصائح أو التوصيات المقدمة أو المعتمدة من TradingView. اقرأ المزيد في شروط الاستخدام.