📊 Current Price Snapshot
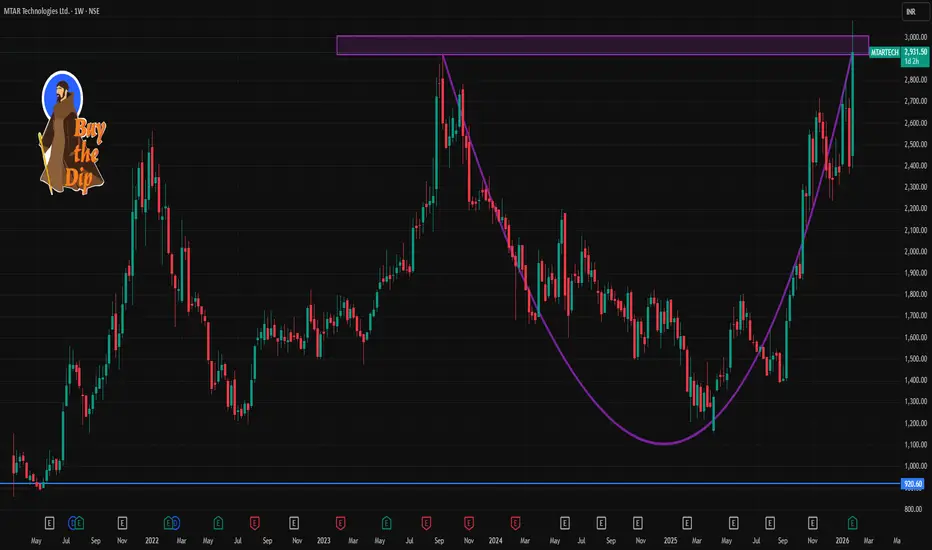
MTAR Technologies closed around ₹2,931–₹2,932 recently.
📈 Weekly Pivot & Support/Resistance Levels
(Important zones likely to act as reference over ~1 week)
🔹 Pivot Levels
These are calculated based on recent price activity and help gauge short-term bias:
Central Pivot ≈ ₹2,909–₹2,954 (key balance level)
🔹 Resistance Levels
Potential upside barriers where price may slow/reverse:
₹2,995–₹3,031 near short-term upper range
₹3,100–₹3,178 next resistance cluster
Above ₹3,200 breakout target (longer weekly/extension)
🔻 Support Levels
Important zones to watch if price pulls back:
₹2,741–₹2,762 area (S1) — near immediate short-term support
₹2,562–₹2,600 range (S2) — strong secondary support
₹2,461–₹2,500 (S3/S4) — deeper pullback zone
These resistances/supports are based on pivot point calculations & Fibonacci extensions covering multiple pivot methods.
📊 Technical Indicators (Short-Term Context)
Moving averages (20, 50, 100, 200 DMA) are largely bullish in daily/weekly analysis, supporting upward momentum.
RSI is near bullish territory but approaching overbought on shorter frames — indicating possible consolidation ahead.
Some technical tools show short-term buy signals; others show neutral — indicating range movement with upside bias.
📌 How to Use These Levels
Bullish Scenario:
➡ Price sustaining above the pivot (~₹2,890-₹2,950) suggests continuation toward ₹3,000 → ₹3,100+ resistance levels.
Bearish/Retracement Scenario:
➡ Failure below pivot or key support near ₹2,740 could trigger pullbacks toward ₹2,600 → ₹2,500 support zones.
This setup works well for 3–7 day trading or planning entry/exit zones.
منشورات ذات صلة
إخلاء المسؤولية
لا يُقصد بالمعلومات والمنشورات أن تكون، أو تشكل، أي نصيحة مالية أو استثمارية أو تجارية أو أنواع أخرى من النصائح أو التوصيات المقدمة أو المعتمدة من TradingView. اقرأ المزيد في شروط الاستخدام.
منشورات ذات صلة
إخلاء المسؤولية
لا يُقصد بالمعلومات والمنشورات أن تكون، أو تشكل، أي نصيحة مالية أو استثمارية أو تجارية أو أنواع أخرى من النصائح أو التوصيات المقدمة أو المعتمدة من TradingView. اقرأ المزيد في شروط الاستخدام.