Comprehensive Trading Plan for Natural Gas (NATGAS)
Market Bias:
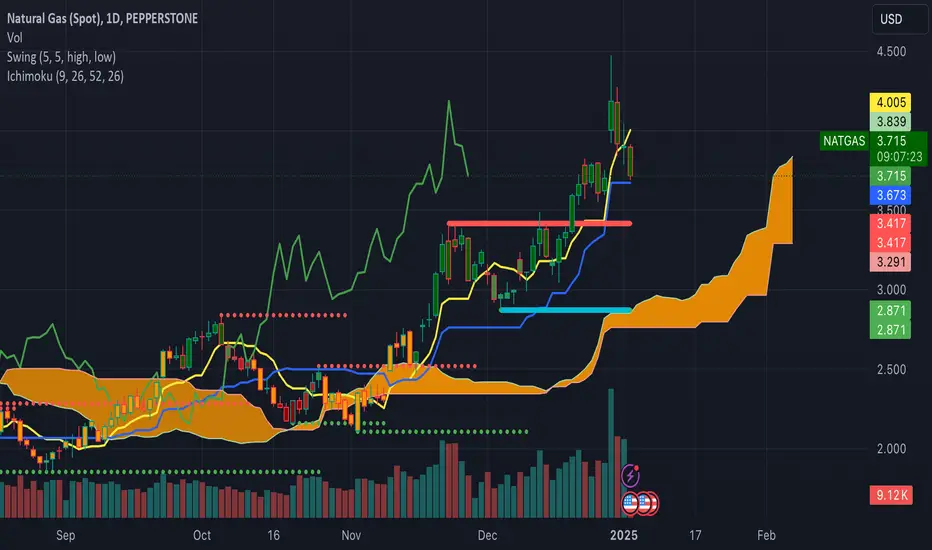
Bullish with a retracement phase:
• Weekly timeframe: Strong uptrend with overbought signals but well above the Ichimoku cloud and SMAs, showing long-term bullish momentum.
• Daily timeframe: Bullish, but in a healthy pullback phase with support around the 0.382 and 0.5 Fibonacci levels.
• 4H timeframe: Price is testing support levels but remains above the Ichimoku cloud and key SMAs (100 and 200), signaling potential for a bullish reversal from oversold conditions.
Key Levels to Watch:
Support Levels (Potential Entry Zones):
1. Primary support: 3.67 - 3.71 (confluence of 100 SMA (4H), Ichimoku cloud, and Fib 0.5-0.618 retracement).
2. Secondary support: 3.54 - 3.59 (Fib 0.786 retracement and approaching 200 SMA on 4H).
3. Deep support: 3.29 - 3.35 (Daily Ichimoku base line and Bollinger Band lower range).
Resistance Levels (Take-Profit Areas):
1. 4.00 - 4.05: Daily Ichimoku base line and Bollinger Band upper resistance.
2. 4.14 - 4.20: Swing high and key Fib extension (1.618).
3. 4.31: Fibonacci extension (potential breakout target).
Actionable Setup:
Entry Plan (Bullish Reversal Strategy):
1. Primary Entry (Shallow Pullback): 3.67 - 3.71:
• Enter long if:
• 4H RSI crosses above 50.
• VW MACD turns green with positive momentum.
• Chaikin Oscillator turns positive, indicating buying inflow.
• Suggested leverage: x10 - x15.
2. Secondary Entry (Deeper Pullback): 3.54 - 3.59:
• Enter long if:
• Price finds support at the 200 SMA (4H).
• OBV forms a higher low and moves upward.
• CMF turns from negative to neutral/positive.
• Suggested leverage: x15.
Stop-Loss (SL):
• Conservative SL: 3.50 (below the Fib 0.786 level).
• Aggressive SL: 3.29 (below Daily Ichimoku base line and 200 SMA).
Take-Profit (TP):
1. TP1: 4.00 - 4.05 (+8.0%) – Ichimoku resistance and round number.
2. TP2: 4.14 - 4.20 (+12%) – Recent swing high and Fib extension.
3. TP3: 4.31 (+16.5%) – Potential breakout target from Fib 1.618 extension.
Trade Conditions for Confirmation:
• Daily RSI: Must remain above 50 to confirm that bullish momentum is intact.
• 2H and 4H MACD: Must show a green shift (waning bearishness and increasing bullish pressure).
• Chaikin Oscillator: Must approach zero or turn positive, confirming capital inflows.
• CMF: Should shift closer to or above zero to validate buying interest.
Position Management:
• Scaling in: Add to the position if price holds above the 100 SMA (4H) after initial entry and indicators remain bullish.
• Move SL: Once price reaches TP1, move stop-loss to breakeven (initial entry).
• Partial take-profit: Secure partial profits at TP1 and TP2 to lock in gains while letting the remaining position run toward TP3.
Example Position Plan:
• Entry: 3.67 - 3.71
• SL: 3.50 (conservative)
• TP1: 4.00 (+8%)
• TP2: 4.14 - 4.20 (+12%)
• TP3: 4.31 (+16.5%)
Additional Notes:
• Risk-to-Reward Ratios (R:R):
• R:R for TP1: ~2:1
• R:R for TP3: ~3.5:1
• Avoid Premature Entries:
• If the price continues below 3.54 without bullish confirmation, wait for a potential re-entry at 3.29 or reassess the structure for further downside.
Summary:
• The overall bias is bullish, but the pullback phase suggests waiting for confirmation signals before entering. Key zones around 3.67 - 3.71 and 3.54 - 3.59 are potential support levels for re-entry, while resistance levels 4.00, 4.14, and 4.31 serve as profit targets. Monitor volume-based indicators (OBV, Chaikin) and trend indicators (MACD, RSI) for validation before entering a long position.
Market Bias:
Bullish with a retracement phase:
• Weekly timeframe: Strong uptrend with overbought signals but well above the Ichimoku cloud and SMAs, showing long-term bullish momentum.
• Daily timeframe: Bullish, but in a healthy pullback phase with support around the 0.382 and 0.5 Fibonacci levels.
• 4H timeframe: Price is testing support levels but remains above the Ichimoku cloud and key SMAs (100 and 200), signaling potential for a bullish reversal from oversold conditions.
Key Levels to Watch:
Support Levels (Potential Entry Zones):
1. Primary support: 3.67 - 3.71 (confluence of 100 SMA (4H), Ichimoku cloud, and Fib 0.5-0.618 retracement).
2. Secondary support: 3.54 - 3.59 (Fib 0.786 retracement and approaching 200 SMA on 4H).
3. Deep support: 3.29 - 3.35 (Daily Ichimoku base line and Bollinger Band lower range).
Resistance Levels (Take-Profit Areas):
1. 4.00 - 4.05: Daily Ichimoku base line and Bollinger Band upper resistance.
2. 4.14 - 4.20: Swing high and key Fib extension (1.618).
3. 4.31: Fibonacci extension (potential breakout target).
Actionable Setup:
Entry Plan (Bullish Reversal Strategy):
1. Primary Entry (Shallow Pullback): 3.67 - 3.71:
• Enter long if:
• 4H RSI crosses above 50.
• VW MACD turns green with positive momentum.
• Chaikin Oscillator turns positive, indicating buying inflow.
• Suggested leverage: x10 - x15.
2. Secondary Entry (Deeper Pullback): 3.54 - 3.59:
• Enter long if:
• Price finds support at the 200 SMA (4H).
• OBV forms a higher low and moves upward.
• CMF turns from negative to neutral/positive.
• Suggested leverage: x15.
Stop-Loss (SL):
• Conservative SL: 3.50 (below the Fib 0.786 level).
• Aggressive SL: 3.29 (below Daily Ichimoku base line and 200 SMA).
Take-Profit (TP):
1. TP1: 4.00 - 4.05 (+8.0%) – Ichimoku resistance and round number.
2. TP2: 4.14 - 4.20 (+12%) – Recent swing high and Fib extension.
3. TP3: 4.31 (+16.5%) – Potential breakout target from Fib 1.618 extension.
Trade Conditions for Confirmation:
• Daily RSI: Must remain above 50 to confirm that bullish momentum is intact.
• 2H and 4H MACD: Must show a green shift (waning bearishness and increasing bullish pressure).
• Chaikin Oscillator: Must approach zero or turn positive, confirming capital inflows.
• CMF: Should shift closer to or above zero to validate buying interest.
Position Management:
• Scaling in: Add to the position if price holds above the 100 SMA (4H) after initial entry and indicators remain bullish.
• Move SL: Once price reaches TP1, move stop-loss to breakeven (initial entry).
• Partial take-profit: Secure partial profits at TP1 and TP2 to lock in gains while letting the remaining position run toward TP3.
Example Position Plan:
• Entry: 3.67 - 3.71
• SL: 3.50 (conservative)
• TP1: 4.00 (+8%)
• TP2: 4.14 - 4.20 (+12%)
• TP3: 4.31 (+16.5%)
Additional Notes:
• Risk-to-Reward Ratios (R:R):
• R:R for TP1: ~2:1
• R:R for TP3: ~3.5:1
• Avoid Premature Entries:
• If the price continues below 3.54 without bullish confirmation, wait for a potential re-entry at 3.29 or reassess the structure for further downside.
Summary:
• The overall bias is bullish, but the pullback phase suggests waiting for confirmation signals before entering. Key zones around 3.67 - 3.71 and 3.54 - 3.59 are potential support levels for re-entry, while resistance levels 4.00, 4.14, and 4.31 serve as profit targets. Monitor volume-based indicators (OBV, Chaikin) and trend indicators (MACD, RSI) for validation before entering a long position.
إخلاء المسؤولية
لا يُقصد بالمعلومات والمنشورات أن تكون، أو تشكل، أي نصيحة مالية أو استثمارية أو تجارية أو أنواع أخرى من النصائح أو التوصيات المقدمة أو المعتمدة من TradingView. اقرأ المزيد في شروط الاستخدام.
إخلاء المسؤولية
لا يُقصد بالمعلومات والمنشورات أن تكون، أو تشكل، أي نصيحة مالية أو استثمارية أو تجارية أو أنواع أخرى من النصائح أو التوصيات المقدمة أو المعتمدة من TradingView. اقرأ المزيد في شروط الاستخدام.