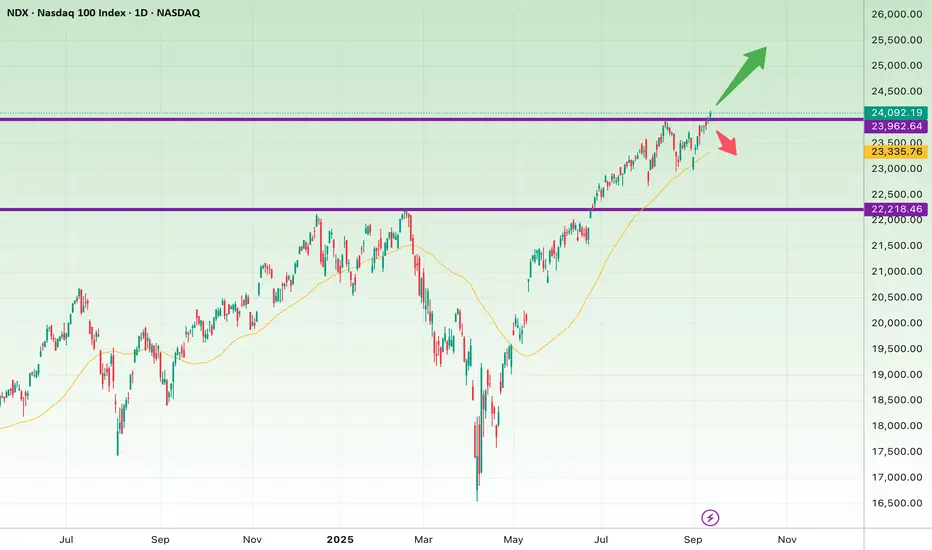
The NDX chart shows that after a strong rally from the 22,200 support zone, the index is now testing a key resistance around 23,950 – 24,100.
Bullish Scenario:
If the daily or weekly candle closes firmly above 24,100, the path opens toward 24,800 – 25,000. Breaking this resistance could trigger a new wave of buying momentum.
Bearish Scenario:
If the index fails to break higher and sellers step in, we may see a pullback toward 23,500 and possibly 22,200.
The 50-day moving average (yellow line) near 23,300 – 23,400 will act as an important mid-term support.
Conclusion:
The market is at a decisive turning point. A breakout above 24,100 signals continuation of the bull run, while rejection here could trigger a deeper correction.
إخلاء المسؤولية
لا يُقصد بالمعلومات والمنشورات أن تكون، أو تشكل، أي نصيحة مالية أو استثمارية أو تجارية أو أنواع أخرى من النصائح أو التوصيات المقدمة أو المعتمدة من TradingView. اقرأ المزيد في شروط الاستخدام.
إخلاء المسؤولية
لا يُقصد بالمعلومات والمنشورات أن تكون، أو تشكل، أي نصيحة مالية أو استثمارية أو تجارية أو أنواع أخرى من النصائح أو التوصيات المقدمة أو المعتمدة من TradingView. اقرأ المزيد في شروط الاستخدام.