📊 Key Levels for Nifty 50 (Daily Timeframe)
Resistance Levels:
R1: 25,471.52
R2: 25,519.43
R3: 25,590.32
Support Levels:
S1: 25,352.72
S2: 25,281.83
S3: 25,233.92
These levels are derived from classic pivot point calculations based on the previous day's price range.
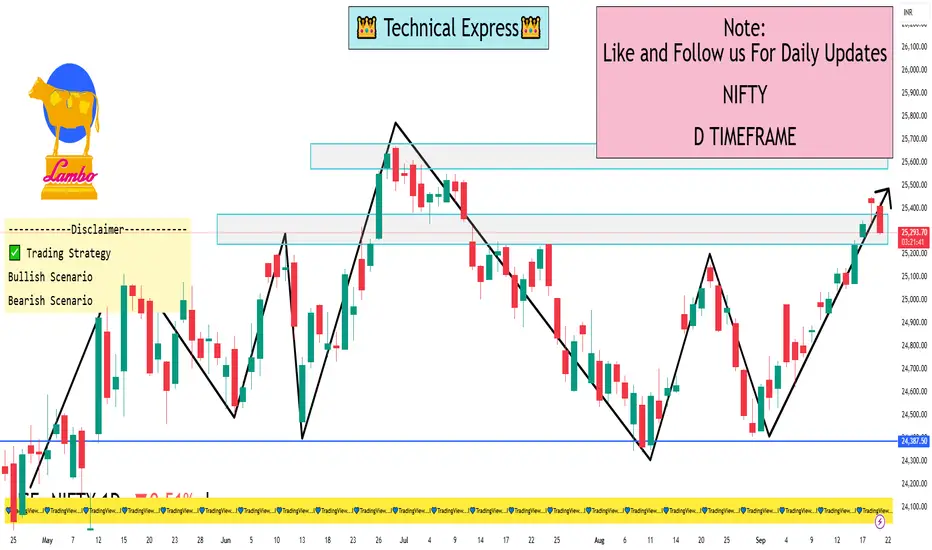
🔄 Trend Analysis
Short-Term Trend: The Nifty 50 has formed a higher top and higher bottom pattern on the daily chart, indicating a bullish trend.
Moving Averages: The index is trading above its 20, 50, 100, and 200-day moving averages, suggesting a bullish momentum.
⚠️ Market Sentiment
Despite the positive technical indicators, the SGX Nifty (Gift Nifty) is showing signs of a negative start, which may influence the market's direction at the open.
✅ Trading Strategy
Bullish Scenario: A sustained move above 25,500 could lead to a retest of the June high at 25,669.
Bearish Scenario: A decline below 25,350 may signal a short-term correction.
Resistance Levels:
R1: 25,471.52
R2: 25,519.43
R3: 25,590.32
Support Levels:
S1: 25,352.72
S2: 25,281.83
S3: 25,233.92
These levels are derived from classic pivot point calculations based on the previous day's price range.
🔄 Trend Analysis
Short-Term Trend: The Nifty 50 has formed a higher top and higher bottom pattern on the daily chart, indicating a bullish trend.
Moving Averages: The index is trading above its 20, 50, 100, and 200-day moving averages, suggesting a bullish momentum.
⚠️ Market Sentiment
Despite the positive technical indicators, the SGX Nifty (Gift Nifty) is showing signs of a negative start, which may influence the market's direction at the open.
✅ Trading Strategy
Bullish Scenario: A sustained move above 25,500 could lead to a retest of the June high at 25,669.
Bearish Scenario: A decline below 25,350 may signal a short-term correction.
I built a Buy & Sell Signal Indicator with 85% accuracy.
📈 Get access via DM or
WhatsApp: wa.link/d997q0
Contact - +91 76782 40962
| Email: techncialexpress@gmail.com
| Script Coder | Trader | Investor | From India
📈 Get access via DM or
WhatsApp: wa.link/d997q0
Contact - +91 76782 40962
| Email: techncialexpress@gmail.com
| Script Coder | Trader | Investor | From India
منشورات ذات صلة
إخلاء المسؤولية
لا يُقصد بالمعلومات والمنشورات أن تكون، أو تشكل، أي نصيحة مالية أو استثمارية أو تجارية أو أنواع أخرى من النصائح أو التوصيات المقدمة أو المعتمدة من TradingView. اقرأ المزيد في شروط الاستخدام.