📊 Nifty Trading Plan for 09-May-2025
Timeframe: 15-Min | Previous Close (Approx.): 24,153.20
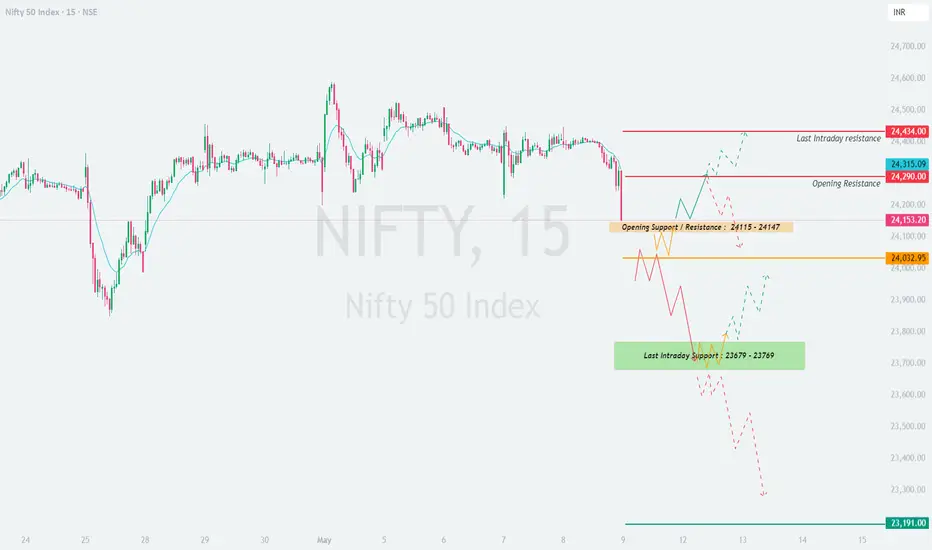
🔎 Key Technical Levels to Watch:
🔴 Opening Resistance: 24,290
🟧 Opening Support / Pivot Zone: 24,115 – 24,147
🟩 Immediate Support Zone: 24,000 – 24,032
🟦 Last Intraday Support Zone: 23,679 – 23,769
🟢 Major Support Level (Further Down): 23,191
📌 Sideways Resistance Zone (Higher Resistance): 24,434 – 24,480
🟢 1. Gap-Up Opening (📈 Opening above 24,253 — Gap of 100+ Points)
If Nifty opens significantly above 24,253, it will likely be challenging the Opening Resistance level of 24,290 from the start. A gap of this nature indicates strong initial buying interest.
✅ Plan of Action:
- If Nifty opens and sustains above 24,290, the initial move might extend towards the Sideways Resistance Zone (Higher Resistance) of 24,434 – 24,480.
- Educational Insight: When a gap up occurs directly into a resistance level (like 24,290), it's crucial to observe the first 15-30 minutes. Look for either:
- Continuation: Strong bullish candles breaking above 24,290 with good volume, confirming buyer strength. In this case, longs can be considered with a stop-loss below the opening range low, targeting 24,434.
- Rejection: If Nifty struggles at 24,290 or shows signs of weakness (e.g., long upper wicks, bearish engulfing patterns on the 15-min chart), it could be a sign of profit-booking or sellers stepping in. Shorts could be initiated below 24,250 (confirming the gap fill has started) for targets of 24,147 and then the Immediate Support Zone of 24,000 – 24,032.
- Avoid chasing the gap immediately. Wait for price to settle and provide a clear signal. A retest of the breakout level (24,290 if breached) from above would offer a better risk-reward entry for longs.
🟡 2. Flat Opening (🔄 Between 24,053 – 24,253)
A flat opening, likely within the range of the Opening Support / Pivot Zone (24,115 – 24,147) and the Opening Resistance (24,290), suggests initial indecision. The previous close of ~24,153 falls into this scenario.
✅ Plan of Action:
- The zone of 24,115 – 24,147 will be key.
- Bullish View: If Nifty holds above 24,147 and shows strength, longs can be initiated for a target of the Opening Resistance at 24,290. A convincing break above 24,290 could then target the Sideways Resistance Zone of 24,434 – 24,480.
- Bearish View: If Nifty breaks below 24,115 and sustains, it would indicate weakness. Shorts can be considered with targets at the Immediate Support Zone of 24,000 – 24,032.
- Educational Insight: Flat openings often lead to range-bound behavior initially. It's wise to wait for a breakout from the first 30-60 minutes range. Trading within the range can be risky unless clear support/resistance flips are observed on smaller timeframes. The direction of the break from this initial balance will likely set the tone for a significant portion of the session.
🔴 3. Gap-Down Opening (📉 Opening below 24,053 — Gap of 100+ Points)
A gap-down opening below 24,053 would mean Nifty is opening near or below the Immediate Support Zone of 24,000 – 24,032. This indicates significant selling pressure from the outset.
✅ Plan of Action:
- If Nifty opens below 24,032, watch how it reacts to this level.
- Potential Reversal: If the market finds support around 24,000 – 24,032 (e.g., forms a hammer, bullish engulfing, or double bottom on the 15-min chart), a bounce-back towards the gap-fill (towards 24,115 – 24,147) can be anticipated. Longs can be taken with strict stop-loss below the day's low.
- Continuation of Selling: If Nifty decisively breaks below 24,000 and sustains, further selling pressure can drag it towards the Last Intraday Support Zone of 23,679 – 23,769. In this case, short positions can be considered on a pullback to the breakdown level (around 24,000) or on continuation patterns.
- Educational Insight: Large gap downs can sometimes lead to sharp, short-covering rallies if they land in a strong support area. However, it's crucial not to try and "catch a falling knife." Wait for the price to stabilize and show signs of reversal (like a clear basing pattern or bullish candle formations) before considering long trades. If selling momentum is strong, attempting to go long too early can lead to quick losses.
💡 Risk Management Tips for Options Trading:
📌 Summary & Conclusion:
Nifty stands at a point where the immediate direction will be heavily influenced by the opening. The pivot zone around 24,115 – 24,147 is crucial for flat openings.
For Gap-Up openings, the ability to conquer and hold above 24,290 will be tested, with 24,434 – 24,480 as the next target. Failure could lead to a gap fill.
For Flat opens, range-bound action between 24,032 and 24,290 is possible initially. A breakout from this range will offer clearer directional cues.
For Gap-Downs, the 24,000 – 24,032 support zone is critical. A hold could offer a bounce, while a break could accelerate selling towards 23,679 – 23,769.
Always prioritize setups that offer good risk-reward ratios, wait for confirmation, and manage your risk diligently.
📢 Disclaimer:
I am not a SEBI-registered analyst. The above trading plan is intended purely for educational and informational purposes. It is based on technical analysis of the provided chart and should not be construed as financial advice. Trading in the stock market involves significant risk, and you may lose money. Please consult with your financial advisor before making any trading or investment decisions.
Timeframe: 15-Min | Previous Close (Approx.): 24,153.20
🔎 Key Technical Levels to Watch:
🔴 Opening Resistance: 24,290
🟧 Opening Support / Pivot Zone: 24,115 – 24,147
🟩 Immediate Support Zone: 24,000 – 24,032
🟦 Last Intraday Support Zone: 23,679 – 23,769
🟢 Major Support Level (Further Down): 23,191
📌 Sideways Resistance Zone (Higher Resistance): 24,434 – 24,480
🟢 1. Gap-Up Opening (📈 Opening above 24,253 — Gap of 100+ Points)
If Nifty opens significantly above 24,253, it will likely be challenging the Opening Resistance level of 24,290 from the start. A gap of this nature indicates strong initial buying interest.
✅ Plan of Action:
- If Nifty opens and sustains above 24,290, the initial move might extend towards the Sideways Resistance Zone (Higher Resistance) of 24,434 – 24,480.
- Educational Insight: When a gap up occurs directly into a resistance level (like 24,290), it's crucial to observe the first 15-30 minutes. Look for either:
- Continuation: Strong bullish candles breaking above 24,290 with good volume, confirming buyer strength. In this case, longs can be considered with a stop-loss below the opening range low, targeting 24,434.
- Rejection: If Nifty struggles at 24,290 or shows signs of weakness (e.g., long upper wicks, bearish engulfing patterns on the 15-min chart), it could be a sign of profit-booking or sellers stepping in. Shorts could be initiated below 24,250 (confirming the gap fill has started) for targets of 24,147 and then the Immediate Support Zone of 24,000 – 24,032.
- Avoid chasing the gap immediately. Wait for price to settle and provide a clear signal. A retest of the breakout level (24,290 if breached) from above would offer a better risk-reward entry for longs.
🟡 2. Flat Opening (🔄 Between 24,053 – 24,253)
A flat opening, likely within the range of the Opening Support / Pivot Zone (24,115 – 24,147) and the Opening Resistance (24,290), suggests initial indecision. The previous close of ~24,153 falls into this scenario.
✅ Plan of Action:
- The zone of 24,115 – 24,147 will be key.
- Bullish View: If Nifty holds above 24,147 and shows strength, longs can be initiated for a target of the Opening Resistance at 24,290. A convincing break above 24,290 could then target the Sideways Resistance Zone of 24,434 – 24,480.
- Bearish View: If Nifty breaks below 24,115 and sustains, it would indicate weakness. Shorts can be considered with targets at the Immediate Support Zone of 24,000 – 24,032.
- Educational Insight: Flat openings often lead to range-bound behavior initially. It's wise to wait for a breakout from the first 30-60 minutes range. Trading within the range can be risky unless clear support/resistance flips are observed on smaller timeframes. The direction of the break from this initial balance will likely set the tone for a significant portion of the session.
🔴 3. Gap-Down Opening (📉 Opening below 24,053 — Gap of 100+ Points)
A gap-down opening below 24,053 would mean Nifty is opening near or below the Immediate Support Zone of 24,000 – 24,032. This indicates significant selling pressure from the outset.
✅ Plan of Action:
- If Nifty opens below 24,032, watch how it reacts to this level.
- Potential Reversal: If the market finds support around 24,000 – 24,032 (e.g., forms a hammer, bullish engulfing, or double bottom on the 15-min chart), a bounce-back towards the gap-fill (towards 24,115 – 24,147) can be anticipated. Longs can be taken with strict stop-loss below the day's low.
- Continuation of Selling: If Nifty decisively breaks below 24,000 and sustains, further selling pressure can drag it towards the Last Intraday Support Zone of 23,679 – 23,769. In this case, short positions can be considered on a pullback to the breakdown level (around 24,000) or on continuation patterns.
- Educational Insight: Large gap downs can sometimes lead to sharp, short-covering rallies if they land in a strong support area. However, it's crucial not to try and "catch a falling knife." Wait for the price to stabilize and show signs of reversal (like a clear basing pattern or bullish candle formations) before considering long trades. If selling momentum is strong, attempting to go long too early can lead to quick losses.
💡 Risk Management Tips for Options Trading:
- [] 📏 Position Sizing is Key: Never allocate more than a small percentage of your trading capital (e.g., 1-2%) to a single trade. This helps in surviving drawdowns.
[] 🎯 Define Stop-Loss Before Entry: For option buyers, this could be a percentage of premium (e.g., 20-30%) or based on the underlying spot Nifty level. For sellers, define the maximum acceptable loss or the spot level at which you'll exit.
[] ⏳ Be Mindful of Time Decay (Theta): Especially when buying options, time decay accelerates as expiry approaches. Avoid holding onto losing OTM (Out-of-the-Money) options for too long, hoping for a turnaround.
[] 🛡️ Consider Hedging for Volatility: If volatility is expected to be high or if you are unsure of the direction, consider strategies like spreads (bull call spread, bear put spread) or iron condors to limit risk.
[] 💨 Don't Fight Strong Momentum: If the market is trending strongly, trading against the trend (e.g., buying puts in a strong uptrend) is generally a lower probability trade for option buyers unless a clear reversal is confirmed.
[] 📖 Understand Option Greeks: A basic understanding of Delta, Gamma, Theta, and Vega can significantly improve your decision-making in options trading.
📌 Summary & Conclusion:
Nifty stands at a point where the immediate direction will be heavily influenced by the opening. The pivot zone around 24,115 – 24,147 is crucial for flat openings.
For Gap-Up openings, the ability to conquer and hold above 24,290 will be tested, with 24,434 – 24,480 as the next target. Failure could lead to a gap fill.
For Flat opens, range-bound action between 24,032 and 24,290 is possible initially. A breakout from this range will offer clearer directional cues.
For Gap-Downs, the 24,000 – 24,032 support zone is critical. A hold could offer a bounce, while a break could accelerate selling towards 23,679 – 23,769.
Always prioritize setups that offer good risk-reward ratios, wait for confirmation, and manage your risk diligently.
📢 Disclaimer:
I am not a SEBI-registered analyst. The above trading plan is intended purely for educational and informational purposes. It is based on technical analysis of the provided chart and should not be construed as financial advice. Trading in the stock market involves significant risk, and you may lose money. Please consult with your financial advisor before making any trading or investment decisions.
إخلاء المسؤولية
لا يُقصد بالمعلومات والمنشورات أن تكون، أو تشكل، أي نصيحة مالية أو استثمارية أو تجارية أو أنواع أخرى من النصائح أو التوصيات المقدمة أو المعتمدة من TradingView. اقرأ المزيد في شروط الاستخدام.
إخلاء المسؤولية
لا يُقصد بالمعلومات والمنشورات أن تكون، أو تشكل، أي نصيحة مالية أو استثمارية أو تجارية أو أنواع أخرى من النصائح أو التوصيات المقدمة أو المعتمدة من TradingView. اقرأ المزيد في شروط الاستخدام.