Hello Friends, Welcome to RK_Chaarts,
Today, we're going to learn how to validate our Elliott Wave analysis by identifying additional factors that support our directional bias. Once we've plotted our Elliott Wave counts and identified a direction, we want to confirm whether other technical indicators and patterns align with our analysis. This helps strengthen our conviction in our directional bias and provides additional confidence in our trading decisions. Today, we'll explore some key points, including Elliott Wave theory, Exponential moving averages, Trend line breakouts, and Invalidation levels, as well as projected targets. And please note that this post is shared solely for educational purposes. It is not a trading idea, tip, or advisory. This is purely an Educational post.
Elliott Wave Theory structure & wave Counts
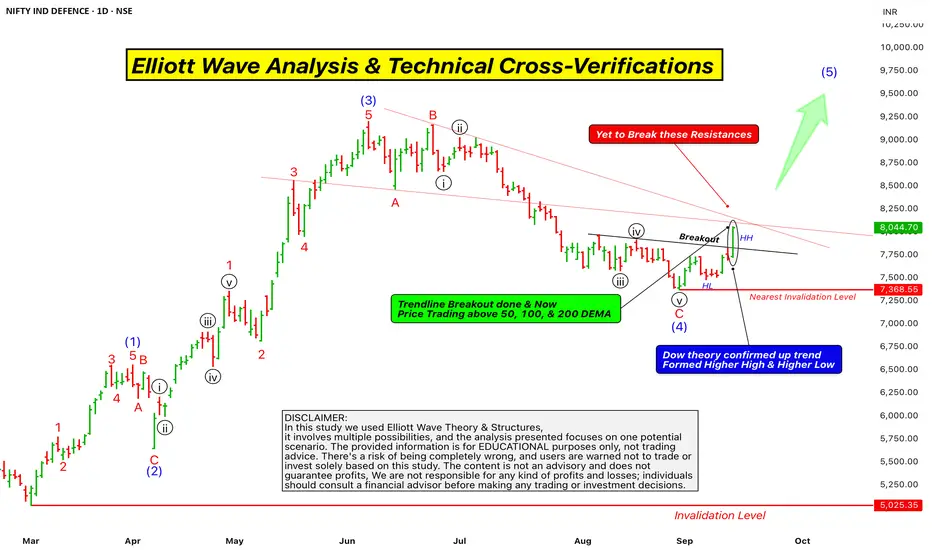
Here chart we are using Nifty India Defence sector, which is an index chart. We are analyzing it using Elliott Wave theory. It's very clear that from the March 2025 bottom, we've identified a clear Wave (1) Wave (2) Wave (3) and Wave (4) and now we've started Wave (5) of Intermediate degree in Blue.

Projections of wave (5)
According to the theory, the projected target for Wave (5) is typically between 123% to 161.8% of the length of Wave (4). So, we can at least assume that the price will reach 123% of Wave (4)’s length, and the price will move higher from here.
Trendline Breakout
The trend line breakout also confirms this. Since Wave (4) moved downwards, Wave (5) should move upwards, indicating a potential upward movement in price. This is a positive signal and a possibility.
Dow Theory confirmation of Trend changed
Additionally, we can see that in the daily time frame, the price has recently completed Wave (4) and formed a higher high, followed by a higher low, and then another higher high, along with a trend line breakout, which we've marked with a rounded ellipse on candle on the chart.
According to Dow theory, this formation of higher highs and higher lows, along with the trend line breakout, indicates that the index has the strength to break through resistance. These two factors strongly support our Elliott Wave projection, which suggests that the price will move upwards. The chart is looking bullish, indicating that a swing has been activated upwards from here.
Exponential Moving Averages
Furthermore, we can see that the price is trading above the 50-day exponential moving average (EMA) in the daily time frame, as well as above the 100-day EMA and the 200-day EMA. These three EMAs are major indicators, and the price is sustaining above all of them. This is also a very good positive sign that supports our view and this scenario.

Supporting Indicators
MACD
RSI
Some Hurdles to cross yet
Finally, we can see that the Zero B trend line, which is coming down from the top, has not been crossed by the price yet, and there has been no breakout. Additionally, we have drawn a trend line connecting the high of the third wave and the low of the fourth wave, which initially acted as resistance and later as support. This trend line is also approaching the same level as the Zero B trend line. So, we have two resistances converging at the same point, which the price has yet to break out of.
This could potentially be a hurdle, and it's possible that according to the Elliott Wave count, Wave (5) will arrive with five sub-divisions, which could lead to a retest of the previous trend line or a Retracement before moving further upwards.
Invalidation Level
According to Elliott Wave theory, the nearest invalidation level is the low of Wave (4), which is currently at 7368, and this level should not be breached. If it is, it will lead to a lower low, which would be an invalidation of the Elliott Wave count.
Overall, the chart of this index looks very promising and bullish. As we all know, the market can be unpredictable, but if this invalidation level is not triggered and the price doesn't break down, then the chart may move upwards with strength. This entire analysis that we discussed is for the Nifty India Defense index chart. Please note that this is not a trading tip or advice, but rather an educational perspective that we shared. Also, keep in mind that the Nifty Defense index is not tradable, but it does provide insight into the market's direction.
This post is shared purely for educational purpose & it’s Not a trading advice.
I am not Sebi registered analyst.
My studies are for educational purpose only.
Please Consult your financial advisor before trading or investing.
I am not responsible for any kinds of your profits and your losses.
Most investors treat trading as a hobby because they have a full-time job doing something else.
However, If you treat trading like a business, it will pay you like a business.
If you treat like a hobby, hobbies don't pay, they cost you...!
Hope this post is helpful to community
Thanks
RK💕
Disclaimer and Risk Warning.
The analysis and discussion provided on in.tradingview.com/u/RK_Chaarts/ is intended for educational purposes only and should not be relied upon for trading decisions. RK_Chaarts is not an investment adviser and the information provided here should not be taken as professional investment advice. Before buying or selling any investments, securities, or precious metals, it is recommended that you conduct your own due diligence. RK_Chaarts does not share in your profits and will not take responsibility for any losses you may incur. So Please Consult your financial advisor before trading or investing.
Today, we're going to learn how to validate our Elliott Wave analysis by identifying additional factors that support our directional bias. Once we've plotted our Elliott Wave counts and identified a direction, we want to confirm whether other technical indicators and patterns align with our analysis. This helps strengthen our conviction in our directional bias and provides additional confidence in our trading decisions. Today, we'll explore some key points, including Elliott Wave theory, Exponential moving averages, Trend line breakouts, and Invalidation levels, as well as projected targets. And please note that this post is shared solely for educational purposes. It is not a trading idea, tip, or advisory. This is purely an Educational post.
Elliott Wave Theory structure & wave Counts
Here chart we are using Nifty India Defence sector, which is an index chart. We are analyzing it using Elliott Wave theory. It's very clear that from the March 2025 bottom, we've identified a clear Wave (1) Wave (2) Wave (3) and Wave (4) and now we've started Wave (5) of Intermediate degree in Blue.
Projections of wave (5)
According to the theory, the projected target for Wave (5) is typically between 123% to 161.8% of the length of Wave (4). So, we can at least assume that the price will reach 123% of Wave (4)’s length, and the price will move higher from here.
Trendline Breakout
The trend line breakout also confirms this. Since Wave (4) moved downwards, Wave (5) should move upwards, indicating a potential upward movement in price. This is a positive signal and a possibility.
Dow Theory confirmation of Trend changed
Additionally, we can see that in the daily time frame, the price has recently completed Wave (4) and formed a higher high, followed by a higher low, and then another higher high, along with a trend line breakout, which we've marked with a rounded ellipse on candle on the chart.
According to Dow theory, this formation of higher highs and higher lows, along with the trend line breakout, indicates that the index has the strength to break through resistance. These two factors strongly support our Elliott Wave projection, which suggests that the price will move upwards. The chart is looking bullish, indicating that a swing has been activated upwards from here.
Exponential Moving Averages
Furthermore, we can see that the price is trading above the 50-day exponential moving average (EMA) in the daily time frame, as well as above the 100-day EMA and the 200-day EMA. These three EMAs are major indicators, and the price is sustaining above all of them. This is also a very good positive sign that supports our view and this scenario.
Supporting Indicators
MACD
RSI
Some Hurdles to cross yet
Finally, we can see that the Zero B trend line, which is coming down from the top, has not been crossed by the price yet, and there has been no breakout. Additionally, we have drawn a trend line connecting the high of the third wave and the low of the fourth wave, which initially acted as resistance and later as support. This trend line is also approaching the same level as the Zero B trend line. So, we have two resistances converging at the same point, which the price has yet to break out of.
This could potentially be a hurdle, and it's possible that according to the Elliott Wave count, Wave (5) will arrive with five sub-divisions, which could lead to a retest of the previous trend line or a Retracement before moving further upwards.
Invalidation Level
According to Elliott Wave theory, the nearest invalidation level is the low of Wave (4), which is currently at 7368, and this level should not be breached. If it is, it will lead to a lower low, which would be an invalidation of the Elliott Wave count.
Overall, the chart of this index looks very promising and bullish. As we all know, the market can be unpredictable, but if this invalidation level is not triggered and the price doesn't break down, then the chart may move upwards with strength. This entire analysis that we discussed is for the Nifty India Defense index chart. Please note that this is not a trading tip or advice, but rather an educational perspective that we shared. Also, keep in mind that the Nifty Defense index is not tradable, but it does provide insight into the market's direction.
This post is shared purely for educational purpose & it’s Not a trading advice.
I am not Sebi registered analyst.
My studies are for educational purpose only.
Please Consult your financial advisor before trading or investing.
I am not responsible for any kinds of your profits and your losses.
Most investors treat trading as a hobby because they have a full-time job doing something else.
However, If you treat trading like a business, it will pay you like a business.
If you treat like a hobby, hobbies don't pay, they cost you...!
Hope this post is helpful to community
Thanks
RK💕
Disclaimer and Risk Warning.
The analysis and discussion provided on in.tradingview.com/u/RK_Chaarts/ is intended for educational purposes only and should not be relied upon for trading decisions. RK_Chaarts is not an investment adviser and the information provided here should not be taken as professional investment advice. Before buying or selling any investments, securities, or precious metals, it is recommended that you conduct your own due diligence. RK_Chaarts does not share in your profits and will not take responsibility for any losses you may incur. So Please Consult your financial advisor before trading or investing.
YouTube: youtube.com/@rk_charts
Telegram : t.me/RK_Charts
Twitter : @charts_rk
Email : rkcharts@gmail. com
Disclaimer.
I am not sebi registered analyst.
My studies are for educational purpose only.
Telegram : t.me/RK_Charts
Twitter : @charts_rk
Email : rkcharts@gmail. com
Disclaimer.
I am not sebi registered analyst.
My studies are for educational purpose only.
منشورات ذات صلة
إخلاء المسؤولية
The information and publications are not meant to be, and do not constitute, financial, investment, trading, or other types of advice or recommendations supplied or endorsed by TradingView. Read more in the Terms of Use.