hi traders,
This technical analysis evaluates the long-term chart of Rivian (RIVN), identifying a major structural shift from a prolonged downtrend to a potential multi-year recovery phase.
1. Technical Setup: The Rounding Bottom & Higher Lows
The most significant development on the weekly chart is the transition of price action from a vertical decline into a stable, rounding bottom structure.
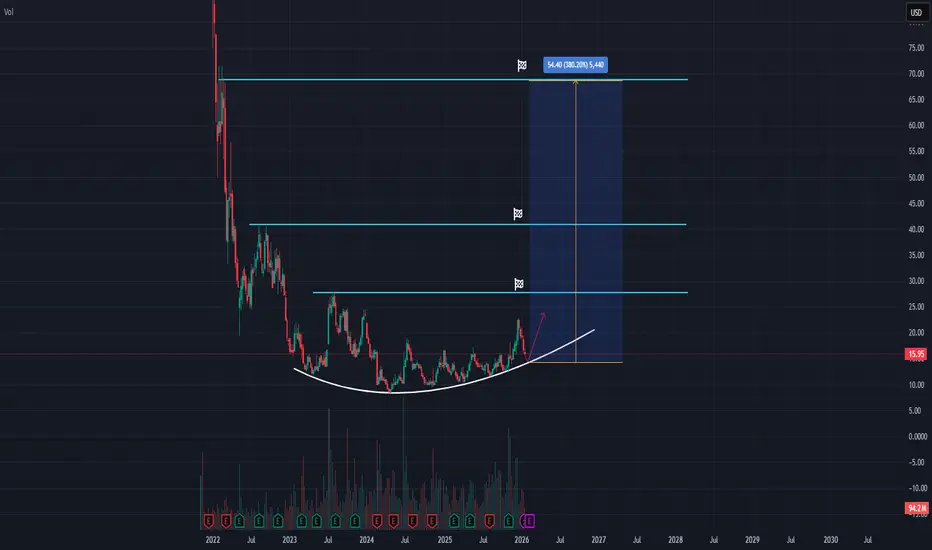
Higher Lows Creation: Since the major lows established in 2023 and early 2024, RIVN has begun to print a series of higher lows. This is visually represented by the white upsloping curve on the chart, which marks the boundary of the new accumulation phase.
Upsloping Price Action: The "bleeding" effect of the initial post-IPO sell-off has ceased. The price is now coiling and showing an upward bias as it follows the curve of the base. This indicates that institutional "smart money" is likely absorbing the remaining supply at these levels.
Support Validation: The level around $10.00 - $12.00 has served as a rock-solid floor, providing the foundation for this emerging uptrend.
2. Momentum & Structure
Consolidation: The price is currently trading near $15.95, resting just above the primary upsloping curve. This consolidation is healthy as it allows the stock to build energy for the next major leg up.
Volume Profile: The volume at the bottom of the structure shows spikes in buying activity, suggesting that the path of least resistance is gradually shifting to the upside.
3. Price Targets (Recovery Roadmap)
Based on the structural resistance levels and flags identified on the chart, we have three primary objectives for the coming years:
Target 1: ~$28.00 – The first major hurdle, representing a return to previous structural consolidation.
Target 2: ~$43.00 – A mid-term target that aligns with a significant historical breakdown point.
Target 3 (Macro Target): ~$70.00 – The ultimate objective for this reversal cycle. As indicated by the flag on the chart, a move to this level represents a massive +380.20% ($54.40) gain from the accumulation base.
4. Fundamental Context
Rivian continues to establish itself as a leader in the premium EV market. With the ramp-up of the R1 platform and the highly anticipated launch of the R2 and R3 models, the company is moving toward a more mass-market scale. This technical bottoming process aligns with the market's realization that Rivian is one of the few EV startups with the capital and brand loyalty to achieve long-term profitability.
Conclusion
The Weekly chart on RIVN is a classic example of a "macro bottom." The creation of higher lows and the upsloping price action suggest that the long-term trend has finally turned. With a clear roadmap toward the $70 target, the risk-to-reward ratio at these levels is exceptionally favorable for long-term investors.
This technical analysis evaluates the long-term chart of Rivian (RIVN), identifying a major structural shift from a prolonged downtrend to a potential multi-year recovery phase.
1. Technical Setup: The Rounding Bottom & Higher Lows
The most significant development on the weekly chart is the transition of price action from a vertical decline into a stable, rounding bottom structure.
Higher Lows Creation: Since the major lows established in 2023 and early 2024, RIVN has begun to print a series of higher lows. This is visually represented by the white upsloping curve on the chart, which marks the boundary of the new accumulation phase.
Upsloping Price Action: The "bleeding" effect of the initial post-IPO sell-off has ceased. The price is now coiling and showing an upward bias as it follows the curve of the base. This indicates that institutional "smart money" is likely absorbing the remaining supply at these levels.
Support Validation: The level around $10.00 - $12.00 has served as a rock-solid floor, providing the foundation for this emerging uptrend.
2. Momentum & Structure
Consolidation: The price is currently trading near $15.95, resting just above the primary upsloping curve. This consolidation is healthy as it allows the stock to build energy for the next major leg up.
Volume Profile: The volume at the bottom of the structure shows spikes in buying activity, suggesting that the path of least resistance is gradually shifting to the upside.
3. Price Targets (Recovery Roadmap)
Based on the structural resistance levels and flags identified on the chart, we have three primary objectives for the coming years:
Target 1: ~$28.00 – The first major hurdle, representing a return to previous structural consolidation.
Target 2: ~$43.00 – A mid-term target that aligns with a significant historical breakdown point.
Target 3 (Macro Target): ~$70.00 – The ultimate objective for this reversal cycle. As indicated by the flag on the chart, a move to this level represents a massive +380.20% ($54.40) gain from the accumulation base.
4. Fundamental Context
Rivian continues to establish itself as a leader in the premium EV market. With the ramp-up of the R1 platform and the highly anticipated launch of the R2 and R3 models, the company is moving toward a more mass-market scale. This technical bottoming process aligns with the market's realization that Rivian is one of the few EV startups with the capital and brand loyalty to achieve long-term profitability.
Conclusion
The Weekly chart on RIVN is a classic example of a "macro bottom." The creation of higher lows and the upsloping price action suggest that the long-term trend has finally turned. With a clear roadmap toward the $70 target, the risk-to-reward ratio at these levels is exceptionally favorable for long-term investors.
💥 Free signals and ideas ➡ t.me/vfinvestment
إخلاء المسؤولية
لا يُقصد بالمعلومات والمنشورات أن تكون، أو تشكل، أي نصيحة مالية أو استثمارية أو تجارية أو أنواع أخرى من النصائح أو التوصيات المقدمة أو المعتمدة من TradingView. اقرأ المزيد في شروط الاستخدام.
💥 Free signals and ideas ➡ t.me/vfinvestment
إخلاء المسؤولية
لا يُقصد بالمعلومات والمنشورات أن تكون، أو تشكل، أي نصيحة مالية أو استثمارية أو تجارية أو أنواع أخرى من النصائح أو التوصيات المقدمة أو المعتمدة من TradingView. اقرأ المزيد في شروط الاستخدام.