🚀 SAP SE – Wave 3 Macro Rally in Progress | Fibonacci Targets & Institutional Accumulation in Play 💼
📅 Timeframe: 3W (Macro Outlook)
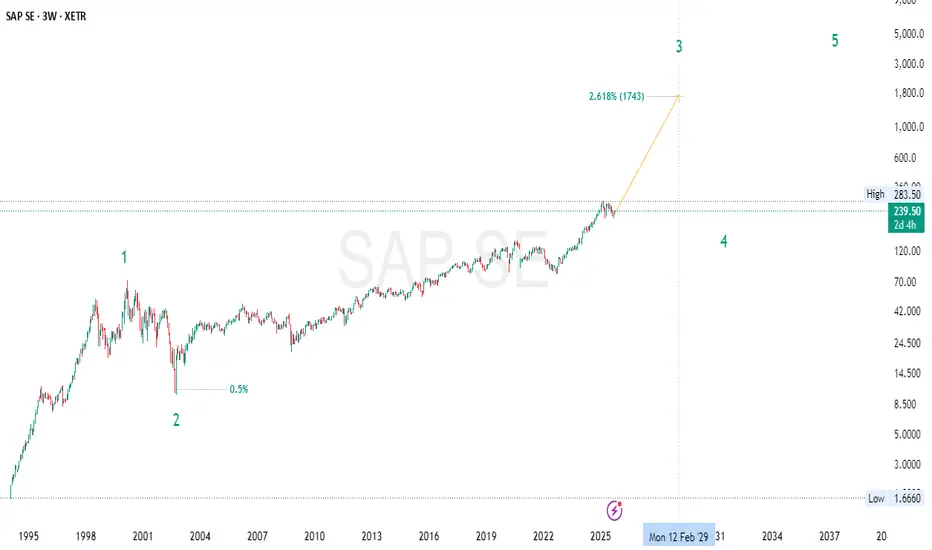
📍 Current Price: 238.85
🎯 Wave 3 Target: ~1743 (2.618 Fibonacci Extension)
📊 Wave Structure & Elliott Theory
SAP SE appears to be mid-way through a major Elliott Wave cycle, where:
🧠 Smart Money Concepts (SMC)
✅ Reaccumulation Range: After an extended period of sideways price action (2001–2019), the chart shows clear signs of Smart Money accumulation – long-term positioning by institutions.
📈 Break of Structure (BOS): Clean break above prior macro highs indicates the end of reaccumulation and the start of a markup phase. This aligns with the SMC concept of entering trades after BOS and mitigation of supply zones.
📦 Liquidity Grab: Previous dips served to collect liquidity before major impulsive moves – a classic institutional playbook.
📐 Fibonacci Confluence
🔹 0.5 Retracement from Wave 1 → Wave 2 provided a textbook correction
🔹 2.618 Extension from Wave 1–2 projects a long-term Wave 3 target of ~1743, giving this move macro-level significance
🔹 No visible divergence yet – momentum is supporting continuation 🌀
🔎 Price Action
🧾 Fundamental Outlook
SAP SE is Europe’s largest software company and a global ERP leader. It’s undergoing a digital transformation into cloud-based SaaS, improving recurring revenue and margins. 💻☁️
📌 Conclusion:
SAP is entering a potentially parabolic phase as part of a long-term Wave 3 impulse, supported by:
As long as price holds above previous structure highs and no macroeconomic shock disrupts the tech cycle, SAP could be heading for an exponential breakout over the coming years.
⚠️ Disclaimer: This is not financial advice. For educational purposes only. Always manage risk and use proper position sizing. 🛡️
#SAP #SAPSE #ElliottWave #WaveAnalysis #Fibonacci #SmartMoney #PriceAction #LongTermInvestment #SwingTrading #TechnicalAnalysis #BullishSetup #MacroView #FibonacciExtensions #StockMarket #TradingStrategy #InstitutionalTrading #Breakout #Reaccumulation #ChartPattern #Fundamentals
📅 Timeframe: 3W (Macro Outlook)
📍 Current Price: 238.85
🎯 Wave 3 Target: ~1743 (2.618 Fibonacci Extension)
📊 Wave Structure & Elliott Theory
SAP SE appears to be mid-way through a major Elliott Wave cycle, where:
- Wave 1 formed during the late 90s tech boom 📈
- Wave 2 brought a deep correction post-2000 crash, respecting the 0.5 Fibonacci retracement
- Wave 3 now underway, projected toward the 2.618 extension at ~1743, suggesting a strong impulsive leg fueled by fundamentals and institutional accumulation
- Wave 4 and 5 to come, but we are early in the Wave 3 journey – historically the most powerful wave in terms of price growth and investor sentiment ⚡
🧠 Smart Money Concepts (SMC)
✅ Reaccumulation Range: After an extended period of sideways price action (2001–2019), the chart shows clear signs of Smart Money accumulation – long-term positioning by institutions.
📈 Break of Structure (BOS): Clean break above prior macro highs indicates the end of reaccumulation and the start of a markup phase. This aligns with the SMC concept of entering trades after BOS and mitigation of supply zones.
📦 Liquidity Grab: Previous dips served to collect liquidity before major impulsive moves – a classic institutional playbook.
📐 Fibonacci Confluence
🔹 0.5 Retracement from Wave 1 → Wave 2 provided a textbook correction
🔹 2.618 Extension from Wave 1–2 projects a long-term Wave 3 target of ~1743, giving this move macro-level significance
🔹 No visible divergence yet – momentum is supporting continuation 🌀
🔎 Price Action
- Higher Highs & Higher Lows structure confirmed on multi-year view 📶
- Strong bullish candles breaking historical resistances
- No major supply zones overhead on the macro chart until much higher levels – suggests room for exponential upside
- Pullbacks remain shallow, indicating strong buy-side pressure
🧾 Fundamental Outlook
SAP SE is Europe’s largest software company and a global ERP leader. It’s undergoing a digital transformation into cloud-based SaaS, improving recurring revenue and margins. 💻☁️
- Strong balance sheet
- Growing enterprise customer base
- Cloud revenue growing YoY
- Excellent positioning in AI and digital infrastructure themes going forward 🔮
- Fundamentals support a multi-year bullish cycle, aligning perfectly with the current Wave 3 structure.
📌 Conclusion:
SAP is entering a potentially parabolic phase as part of a long-term Wave 3 impulse, supported by:
- 📈 Elliott Wave alignment
- 🔁 Institutional reaccumulation (SMC)
- 🔍 Strong technical structure & price action
- 📐 Fibonacci confluence
- 💼 Solid fundamental trajectory
As long as price holds above previous structure highs and no macroeconomic shock disrupts the tech cycle, SAP could be heading for an exponential breakout over the coming years.
⚠️ Disclaimer: This is not financial advice. For educational purposes only. Always manage risk and use proper position sizing. 🛡️
#SAP #SAPSE #ElliottWave #WaveAnalysis #Fibonacci #SmartMoney #PriceAction #LongTermInvestment #SwingTrading #TechnicalAnalysis #BullishSetup #MacroView #FibonacciExtensions #StockMarket #TradingStrategy #InstitutionalTrading #Breakout #Reaccumulation #ChartPattern #Fundamentals
إخلاء المسؤولية
لا يُقصد بالمعلومات والمنشورات أن تكون، أو تشكل، أي نصيحة مالية أو استثمارية أو تجارية أو أنواع أخرى من النصائح أو التوصيات المقدمة أو المعتمدة من TradingView. اقرأ المزيد في شروط الاستخدام.
إخلاء المسؤولية
لا يُقصد بالمعلومات والمنشورات أن تكون، أو تشكل، أي نصيحة مالية أو استثمارية أو تجارية أو أنواع أخرى من النصائح أو التوصيات المقدمة أو المعتمدة من TradingView. اقرأ المزيد في شروط الاستخدام.