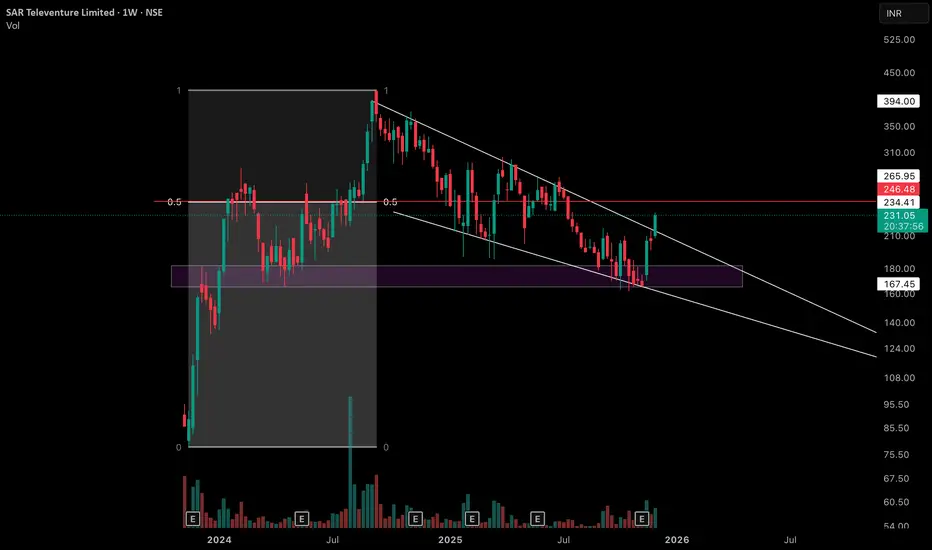
Observation 1 - On this weekly chart of SAR Televenture Limited, price has created an interesting equilibrium between the major swing low and the all‑time high swing high, with the 0.5 level highlighted by the red horizontal line as a key mid‑point reference.
Observation 2 - The purple zone marked on the chart was earlier a clear supply / resistance area but has now flipped into a support zone, getting respected multiple times over the past several weeks.
Observation 3 - After printing its all‑time high, price has moved into a sequence of lower highs and lower lows, but each leg has remained relatively controlled instead of showing any one‑sided, sharp liquidation move. This creates a broader consolidation structure where volatility is present yet contained.
Observation 4 - The white lines on the chart represent the upper and lower rejection boundaries of this consolidation channel, and most of the recent candles are developing within these two lines.
Disclaimer: This post is purely for educational and informational purposes, intended to study price structure and market behavior on the weekly timeframe. It is not investment advice or a recommendation to buy or sell any security; traders and investors should do their own research and consult a registered financial professional before making any decisions.
🎯 Master My Self-Made Trading Strategy
📈 Telegram (Learn Today): t.me/hashtaghammer
✅ WhatsApp (Learn Today): wa.me/919455664601
📈 Telegram (Learn Today): t.me/hashtaghammer
✅ WhatsApp (Learn Today): wa.me/919455664601
منشورات ذات صلة
إخلاء المسؤولية
لا يُقصد بالمعلومات والمنشورات أن تكون، أو تشكل، أي نصيحة مالية أو استثمارية أو تجارية أو أنواع أخرى من النصائح أو التوصيات المقدمة أو المعتمدة من TradingView. اقرأ المزيد في شروط الاستخدام.