📌 Key data
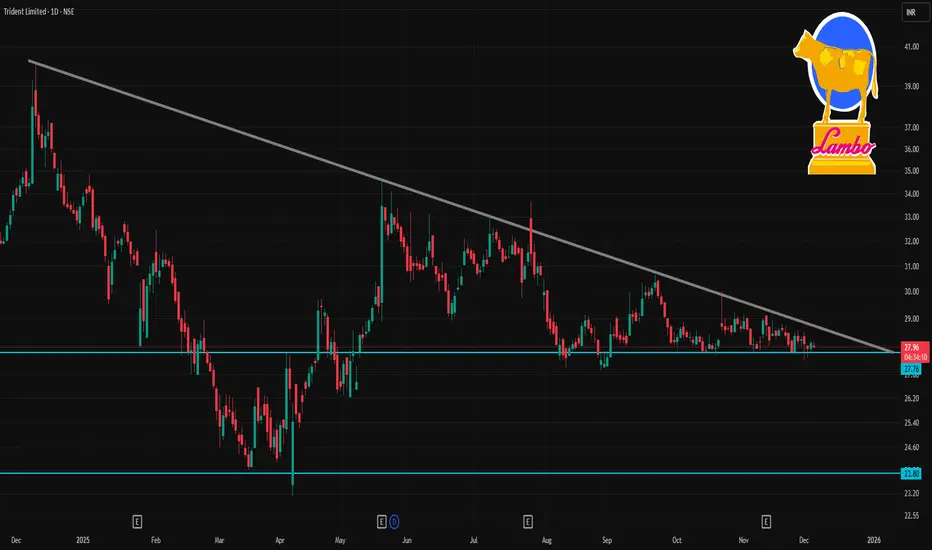
Current price: ~₹28.2.
52-week high / low: ₹40.20 / ₹23.11.
🧭 Pivot / Support / Resistance (1-day based)
Based on a daily pivot-point analysis:
Level Price
Pivot (daily mid) ~ ₹28.02
Resistance 1 (R1) ~ ₹28.32
Resistance 2 (R2) ~ ₹28.53
Support 1 (S1) ~ ₹27.81
Support 2 (S2) ~ ₹27.51
Because the stock is already around ₹28.2, intraday traders might treat ~₹28.5 as a near-term resistance, and ~₹27.5–₹27.8 as the support zone (on a breakdown).
⚠️ What to watch / Risks
Technical signals are mixed: some moving averages are “outperform/positive”, but many oscillators and technical-indicator-based services are still flagging a “sell/neutral” bias on the daily chart.
The stock has underperformed over long term — price is much below 52-wk high, returns have been weak — so volatility or broader market sentiment could sway levels significantly.
منشورات ذات صلة
إخلاء المسؤولية
لا يُقصد بالمعلومات والمنشورات أن تكون، أو تشكل، أي نصيحة مالية أو استثمارية أو تجارية أو أنواع أخرى من النصائح أو التوصيات المقدمة أو المعتمدة من TradingView. اقرأ المزيد في شروط الاستخدام.
منشورات ذات صلة
إخلاء المسؤولية
لا يُقصد بالمعلومات والمنشورات أن تكون، أو تشكل، أي نصيحة مالية أو استثمارية أو تجارية أو أنواع أخرى من النصائح أو التوصيات المقدمة أو المعتمدة من TradingView. اقرأ المزيد في شروط الاستخدام.