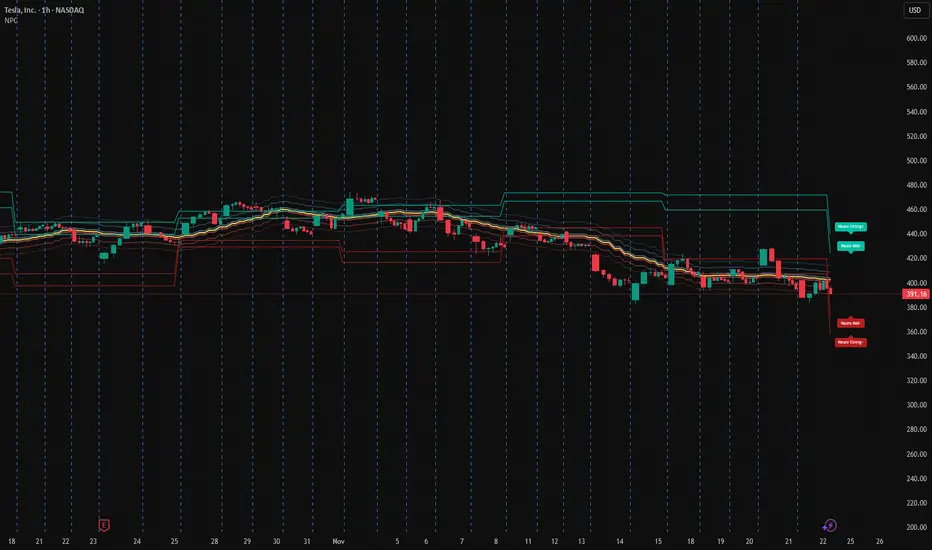
Tesla is currently trading inside a NPC post-distribution compression range after breaking down from the upper volatility structure.
Instead of predicting direction, here’s the statistical positioning based on the NeuroPolynomial Channel:
Current Positioning:
• Price under NPC Core Cluster
• Distance to lower stress band: ~1.4%
• Distance to upper expansion band: ~3.2%
• Compression vs prior impulse: ~0.61
NPC Volatility Map:
• Upper Expansion Zone: +3% to +3.8%
• Core Equilibrium: 400–412 zone
• Lower Rejection Band: −1.4%
• Breakdown Continuation Zone: −2.8% to −3.5%
Interpretation (scenario-based):
– Sustained acceptance above core → structural rebuild attempt
– Rejection at core → continuation inside stress band
– Re-entry into strong-lower → extension zone unlock
This is a volatility structure map, not a prediction model.
AI-driven market structure analysis.
إخلاء المسؤولية
لا يُقصد بالمعلومات والمنشورات أن تكون، أو تشكل، أي نصيحة مالية أو استثمارية أو تجارية أو أنواع أخرى من النصائح أو التوصيات المقدمة أو المعتمدة من TradingView. اقرأ المزيد في شروط الاستخدام.
AI-driven market structure analysis.
إخلاء المسؤولية
لا يُقصد بالمعلومات والمنشورات أن تكون، أو تشكل، أي نصيحة مالية أو استثمارية أو تجارية أو أنواع أخرى من النصائح أو التوصيات المقدمة أو المعتمدة من TradingView. اقرأ المزيد في شروط الاستخدام.