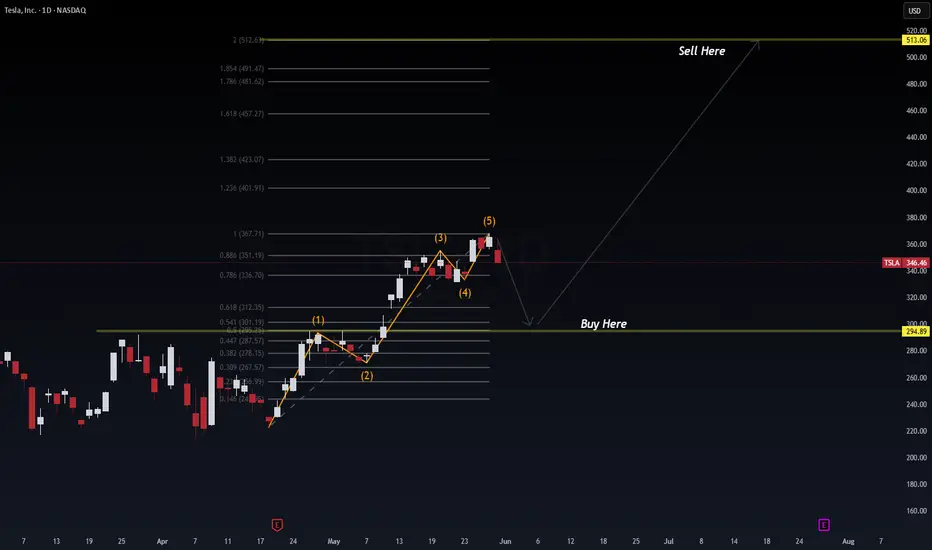
Tesla completed a textbook 5-wave Elliott impulse to the upside, topping out near the 1.0 Fibonacci extension ($367.71). We're now seeing signs of a corrective wave likely targeting the golden zone near $294.89 — aligning with SPY/NVDA retracements.
🔍 Elliott Wave Count:
Wave (1): Impulse from breakout
Wave (2): Shallow pullback
Wave (3): Extended rally
Wave (4): Minor correction
Wave (5): Final push – now failing
📉 Fibonacci Zones:
Current Price: $346.46
Wave 5 Completion: ~$367
Retracement Target: $294.89 (0.5–0.618 confluence)
Extension Target: $513.06 (2.0 extension from wave base)
📊 Probabilistic Outlook
🔻 Correction to $294.89 = 70% probability (based on wave structure + Fib retracement logic)
🔼 Rally to $513+ = 60% probability if support holds and market conditions remain risk-on
🌐 Macro Alignment (May 31, 2025)
🔄 Market rotation into value → temporary tech cooldown
📉 NVDA false breakout and SPY retracement suggest broader pullback
🧠 Tesla is a beta-multiplier to NASDAQ; expect correlation
🧭 Trade Plan:
Buy Zone: $294.89 (watch for confirmation + volume spike)
Sell Target: $513.06 (Fib 2.0 extension)
Stop: Below $278 (structure invalidation)
🧠 Pro Insight:
This is a Wave 2/4 retracement zone where institutions often reload. The broader macro pullback may present one of the last deep dips before a Q3 breakout.
#TSLA #ElliottWave #FibLevels #TechStocks #SmartMoney #SwingTrade #NASDAQ #WaverVanir #TradingView
ملاحظة
WaverVanir ⚡ To grow and conquer
stocktwits.com/WaverVanir | wavervanir.com | buymeacoffee.com/wavervanir
Not Investment Advice
stocktwits.com/WaverVanir | wavervanir.com | buymeacoffee.com/wavervanir
Not Investment Advice
إخلاء المسؤولية
لا يُقصد بالمعلومات والمنشورات أن تكون، أو تشكل، أي نصيحة مالية أو استثمارية أو تجارية أو أنواع أخرى من النصائح أو التوصيات المقدمة أو المعتمدة من TradingView. اقرأ المزيد في شروط الاستخدام.