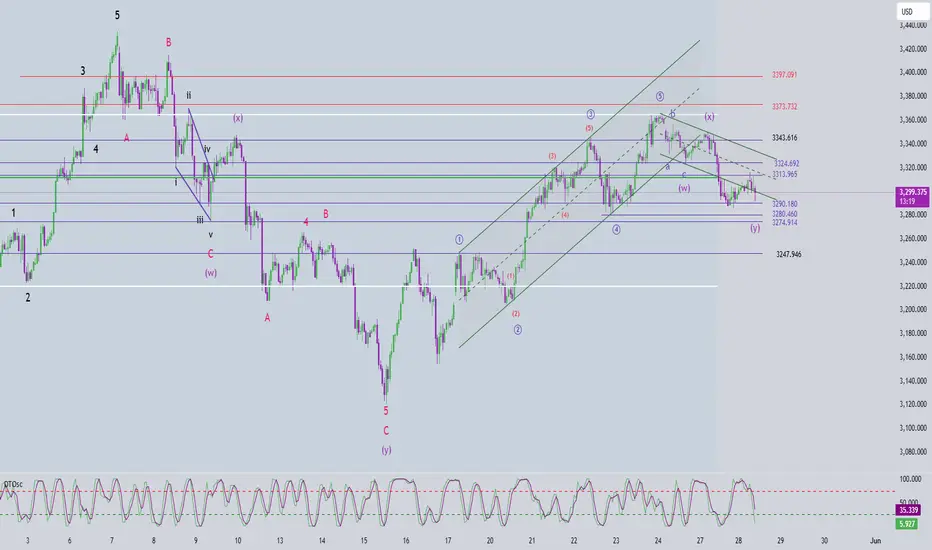
🔍 Current Wave Structure
After a sharp drop yesterday, price has mildly recovered and is now consolidating around the 3314 zone. The correction has nearly reached the target of wave C (green). However, the current rebound is weak, marked by small, overlapping H1 candles — suggesting the bullish structure is not yet convincing.
At this point, we’re tracking two main scenarios:
✅ Scenario 1 – Correction Completed
Wave C seems complete, and price might be starting a new bullish trend.
That said, the overlapping candles on H1 could also indicate the formation of a leading diagonal for wave 1.
In this case, wave 2 is likely to be a strong retracement — typically forming as a zigzag or flat correction.
📌 Strategy:
Wait for wave 2 to complete before looking for a better buy opportunity.
🌀 Scenario 2 – Correction Still in Progress
If the price continues to move slowly or goes sideways, we could be in wave b of a double zigzag correction (wave Y).
🎯 Wave c within wave Y may target 3324.
However, if price breaks below 3284 before hitting 3324, it would likely mean wave c has started, with an expected end near 3280–3274.
📈 Momentum Outlook
D1: Momentum remains bearish ⇒ primary trend still points downward.
H4: Momentum is currently rising ⇒ we may see a temporary recovery today.
H1: Approaching oversold ⇒ if reversal signals appear, short-term buy setups may emerge.
🎯 Trade Plan for Today (28/05/2025)
🔹 Buy Scalp
Entry: 3292 – 3289
SL: 3282
TP1: 3313
TP2: 3324
🔹 Buy Swing
Entry: 3280 – 3277
SL: 3270
TP1: 3290
TP2: 3313
TP3: 3324
🕰️ Expected timing: From London session through New York close
🔸 Sell Zone
Entry: 3324 – 3327
SL: 3334
TP1: 3313
TP2: 3290
TP3: 3280
🕰️ Ideal entry: If price hits resistance during US session or late London
📌 All scenarios will be updated as soon as wave 2 completes or if price clearly breaks below 3284.
Be patient — let the market confirm before taking action.
تم فتح الصفقة
🕵️♂️ H4 Chart Observation – XAUUSDOn the H4 timeframe, we’re seeing bullish candles with short bodies, indicating a lack of strong momentum behind the move.
📈 H4 momentum is approaching overbought territory —
If the current candle closes and the next one follows through, we could start seeing signs of a potential bearish reversal.
🔍 Our plan:
Keep monitoring H4 momentum. Once it enters the overbought zone, we’ll shift to the H1 timeframe to look for Sell setups with confirmation.
أغلقت الصفقة: تم الوصول للهدف
170 pips Entry Sell: 3324 – 3327ملاحظة
270 pips Entry Sell: 3324 – 3327 Full TP2📢 Sometimes signals appear on TradingView with a slight delay!
🚀 Join our Telegram channel to get instant updates and real-time scalping signals:
👉 t.me/+xkFQ95yHVOEwNDc1
🚀 Join our Telegram channel to get instant updates and real-time scalping signals:
👉 t.me/+xkFQ95yHVOEwNDc1
إخلاء المسؤولية
لا يُقصد بالمعلومات والمنشورات أن تكون، أو تشكل، أي نصيحة مالية أو استثمارية أو تجارية أو أنواع أخرى من النصائح أو التوصيات المقدمة أو المعتمدة من TradingView. اقرأ المزيد في شروط الاستخدام.
📢 Sometimes signals appear on TradingView with a slight delay!
🚀 Join our Telegram channel to get instant updates and real-time scalping signals:
👉 t.me/+xkFQ95yHVOEwNDc1
🚀 Join our Telegram channel to get instant updates and real-time scalping signals:
👉 t.me/+xkFQ95yHVOEwNDc1
إخلاء المسؤولية
لا يُقصد بالمعلومات والمنشورات أن تكون، أو تشكل، أي نصيحة مالية أو استثمارية أو تجارية أو أنواع أخرى من النصائح أو التوصيات المقدمة أو المعتمدة من TradingView. اقرأ المزيد في شروط الاستخدام.