I. Core Fundamentals
The Game of Bulls and Bears
Bullish Factors:
90% probability of a September Fed rate cut (weak non-farm payrolls reinforce easing expectations, suppressing the US dollar).
Escalating geopolitical risks (Middle East situation, trade frictions) stimulate safe-haven demand.
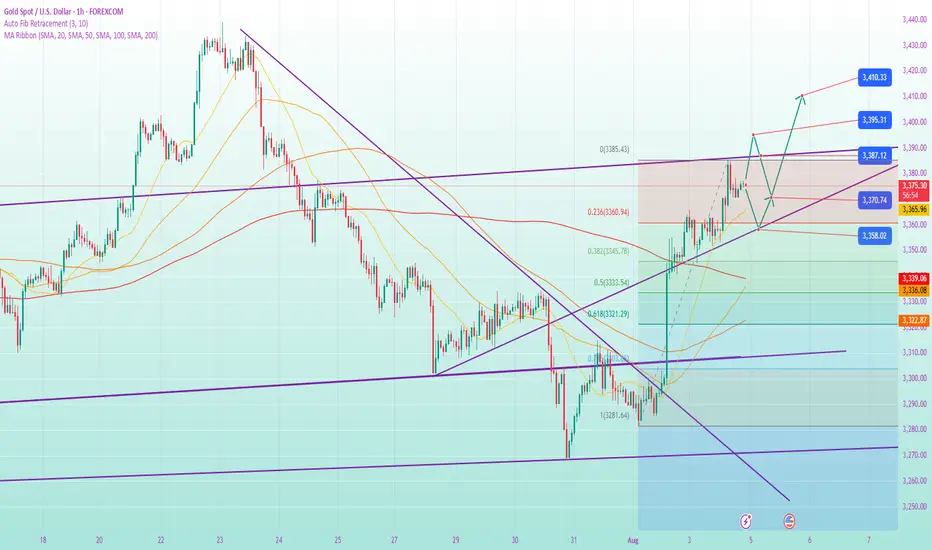
Technical Analysis: Weekly chart stabilizes (a long lower shadow bullish candlestick confirms support in the 3340-3350 area).
Bearish Pressure:
Short-term US dollar rebound (US Treasury yields rebound, gold under pressure).
High-level profit-taking pressure (3400-3450 is a historically strong resistance zone).
Key Events Outlook:
This week's focus: Fed officials' speeches and US CPI data (if inflation falls, expectations of a rate cut will rise again).
Risk Warning: If the US dollar rebounds or geopolitical tensions ease, gold may retest the 3300-3335 support level.
II. Technical Multi-Period Resonance Analysis
Weekly:
A bullish candlestick with a long lower shadow and holding above the middle band indicates a bullish medium-term trend, with a target of 3460-3470 (upper channel band).
Key support: 3340 (middle band); a break below would trigger a period of volatility; strong support at 3300 (the last line of defense for bulls).
Daily:
Converging triangle pattern: Lower support at 3345-3348 (10-day moving average), upper resistance at 3410.
After three attempts to break through 3450, the probability of a fourth attempt increases significantly, with a target of 3500+.
4-Hour Short-Term:
After the non-farm payroll report, the market has broken above the middle band, with 3356-3360 as the bull-bear watershed today.
MACD death cross correction, but rising lows (3345 → 3356), suggests a buildup of momentum for an upside move from above.
III. Today's Precision Trading Strategy
🎯 Main Strategy: Buy on pullbacks, supplemented by shorting at key resistance levels
Long Opportunities:
Conservative Level: Enter if it stabilizes at 3356-3360 (4-hour middle line), stop loss at 3345, target 3377-3385.
Aggressive Level: If the market stabilizes at 3368 during the European session, go long with a small position, stop loss at 3355, target 3393.
Short Opportunities:
Short on the first attempt to break through 3390-3400 (daily upper line), stop loss at 3410, target 3370.
Breakthrough Strategy:
If it breaks through 3385 with large volume, chase long positions and target 3400-3410, stop loss at 3375.
⚠️ Risk Management Tips:
Implement strict stop-loss orders! If it falls below 3356, temporarily avoid long positions and wait for support at 3340 before repositioning. If the US market rises and then falls, be wary of a "false breakout" and monitor whether 3368 can become support.
IV. Medium- to Long-Term Strategy Guidelines
Conditions for a Bull Market Trigger:
Weekly close above 3410, confirming a breakout from the converging triangle, with a target of 3500-3600.
The Fed's September rate cut, or escalating geopolitical crises, will accelerate the rise.
Risk Warning:
If the US dollar index rebounds above 106, gold may pull back to the 3250-3200 area.
Summary
Short-term: 3356-3360 is today's lifeline. If it holds, bulls will continue to squeeze, and if it falls below, it will turn into a volatile market.
Medium- to Long-term: The longer the sideways movement, the stronger the potential for a breakout. Patiently wait for a signal to break through 3450.
📌 Action Recommendation: Buy primarily during pullbacks to lower levels during the Asian and European sessions. Watch for momentum to break through 3385 during the US session and strictly follow the trend!
تم فتح الصفقة
Comprehensive Analysis of the Latest Gold Market Trends (August 5, 2025)
I. Core Drivers
Surge in Safe-Haven Demand
The escalation of US tariffs on India and other countries has triggered global trade tensions, and geopolitical uncertainty has bolstered gold's appeal as a safe-haven asset.
Personnel changes within the Trump administration (the dismissal of the Director of the Bureau of Labor Statistics and the resignation of a Federal Reserve Board member) have exacerbated policy uncertainty.
Expectations of a Fed rate cut have strengthened.
Weak US employment data (such as the July non-farm payroll report) and economic indicators (such as the ISM manufacturing PMI) have increased market bets on a September rate cut, weighing on the US dollar and benefiting gold.
Weak US Dollar Index
Although the US dollar index rose slightly by 0.06% to 98.73, the long-term economic outlook has weighed on the rebound, providing support for gold.
II. Key Technical Signals
Short-Term Trend: High-Level Convergence, Beware of Market Reversal Risks
Weakened Bullish Momentum: After a period of continuous gains in gold, the hourly chart shows a slowdown in the upward slope, and the 30-minute chart shows an overbought signal (RSI nearing 70), alerting investors to profit-taking.
Key Resistance and Support
Upper Resistance: 3385 (yesterday's high), 3390 (psychological barrier).
Support below: 3370 (short-term bull-bear boundary), 3340-3330 (adjustment target position).
Pattern Analysis
Potential Double Top Risk: If gold prices fail to break through 3385 and fall below 3370, a 30-minute double top could form, triggering a pullback to the 3340-3330 range.
Breakout Signal: A sustained break above 3390 would open up potential for a move to 3400-3420.
III. Trading Strategy Recommendations
Short-Term Trading Strategies
Short on Rebounds: Test short positions in the 3380-3385 range with a light position, stop loss at 3395, and target at 3360-3340.
Long on Pullbacks: Arrange long positions in batches in the 3340-3330 range, stop loss at 3320, and target at 3360-3375.
Risk Warning
If the market surges directly to around 3385, prioritize executing short positions. If it quickly breaks below 3370, a short-term top will be confirmed, and caution should be exercised in pursuing short positions (avoid baiting at low levels).
Watch the European session: If it fluctuates above 3370, consolidation at high levels is likely; if it breaks below, a correction will accelerate.
IV. Today's Key Focus
Data and Events: Fed officials' speeches (dovish signals will reinforce expectations of rate cuts).
Market Sentiment: Progress in global trade frictions and the US dollar index.
In summary, gold is supported in the short term by risk aversion and expectations of rate cuts, but technically it is overbought and needs adjustment. We recommend buying at 3385-3390 as a defensive high and 3340-3330 as a support level, with strict stop-loss orders. If key levels are broken, follow the trend.
(Note: The above analysis is based on the current market environment; specific operations should be adjusted based on real-time data.)
أغلقت الصفقة: تم الوصول للهدف
Will gold break out of its range and rise on August 6th?
I. Market Background and Recent Developments
Fundamental Drivers
Rising Expectations of a Fed Rate Cut: Recent weak US economic data (non-farm payrolls, manufacturing PMI, etc.) has reinforced market bets on a September rate cut, which is bullish for gold in the medium and long term.
Safe-haven Demand: Intensified global trade tensions (such as the US-China tariff issue) and geopolitical risks are increasing safe-haven buying for gold.
Impact of the US Dollar's Trend: If the US dollar weakens due to expectations of a rate cut, gold may rise further; conversely, a rebound in the US dollar could suppress gold prices.
II. Key Technical Analysis
1. Short-Term Trend: Weak and volatile, focusing on the 3340-3390 range.
Key Support:
3345-3340 (38.2% Fibonacci retracement level)
3335 (if broken, the decline could accelerate to 3328).
Key resistance:
3365 (mid-line watershed, if it holds, it will turn into a volatile market)
3385-3390 (previous high, strong pressure, a breakout opens up upside potential).
2. MACD and Momentum Analysis
MACD Divergence Correction: Yesterday's decline corrected the overbought condition. If it stabilizes around 3340, it may rebound again.
RSI (4H): Currently below 50, the short-term trend remains bearish, but approaching the oversold zone (below 30) may trigger a rebound.
III. Today's Trading Strategy
1. Low-to-Long Strategy (3340-3350 Area)
Entry Point: 3350-3352. Try buying with a light position. If it falls to 3340-3345, add to your position.
Stop Loss: Below 3340 (3338) to prevent false breakouts.
Target: 3365 (first take-profit) → 3375 (second target).
2. High-Sell Strategy (3395-3400 Area)
If the market first touches the 3395-3400 area: Set up a short position with a stop-loss at 3405 and a target of 3380-3370.
3. Breakout Strategy
If the market breaks through 3385: Go long if it stabilizes at 3370, with a target of 3400.
If the market breaks below 3340: Wait and see if it stabilizes near 3330 before considering a low-level long position.
IV. Risk Warning
Focus on US market data: Fed officials' speeches may impact market sentiment.
Adhere to a strict stop-loss order: Avoid large losses caused by one-sided market movements.
Adjust your strategy flexibly: If the market breaks through key levels quickly, adjust your strategy promptly.
منشورات ذات صلة
إخلاء المسؤولية
لا يُقصد بالمعلومات والمنشورات أن تكون، أو تشكل، أي نصيحة مالية أو استثمارية أو تجارية أو أنواع أخرى من النصائح أو التوصيات المقدمة أو المعتمدة من TradingView. اقرأ المزيد في شروط الاستخدام.
إخلاء المسؤولية
لا يُقصد بالمعلومات والمنشورات أن تكون، أو تشكل، أي نصيحة مالية أو استثمارية أو تجارية أو أنواع أخرى من النصائح أو التوصيات المقدمة أو المعتمدة من TradingView. اقرأ المزيد في شروط الاستخدام.