Chart Observation (5m timeframe):
Trend:
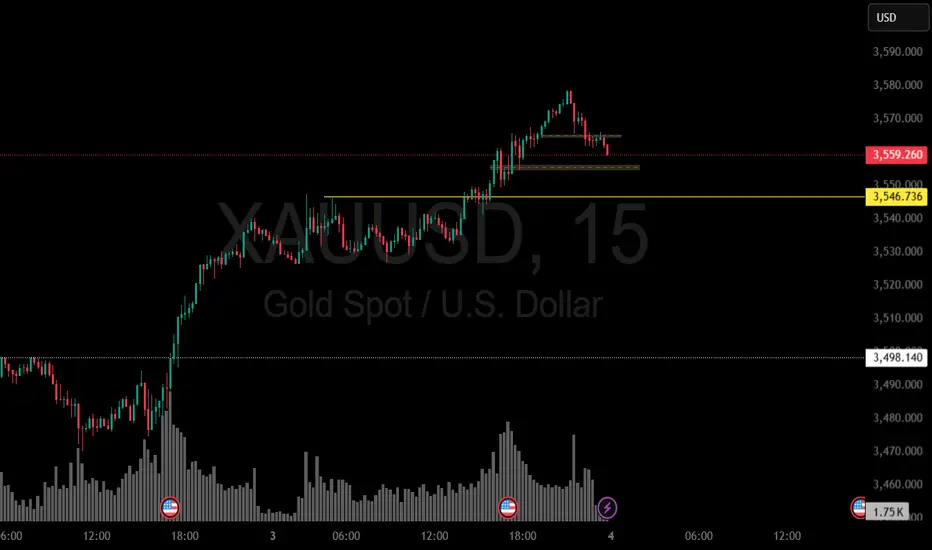
Gold is currently in a strong bullish trend – you can see higher highs and higher lows forming consistently.
Volume Spike:
The rally after 18:00 came with increasing volume, showing strong buying interest and liquidity injection.
Resistance Zone:
Current price = 3576
The round psychological level is 3580 – 3600 (a possible short-term resistance).
Support / Demand Zone:
Immediate demand zone: 3550 – 3560 (recent consolidation before the breakout).
Deeper support: 3520 – 3530 (if price retraces hard).
📊 Price Action Analysis
Since market is trending up, buying is safer than selling.
A small correction may occur soon (because price is extended), but as long as 3550 holds, the trend remains bullish.
✅ Trading Plan
Buying Area (Best Entries):
3550 – 3560 zone (ideal pullback entry).
If that breaks, 3520 – 3530 is the next strong demand zone.
Selling Area (Short Entries):
Around 3580 – 3600 (short-term resistance, scalp sell possible).
But selling is counter-trend, so take quick profits only.
Trend Bias:
Bullish. Wait for retracements to enter long instead of chasing high candles.
⚠️ Pro Tip:
Mark the 3550 level on your chart – if 5m candle closes strong below it, short-term bearish correction possible. If it holds, next target = 3600+.
Trend:
Gold is currently in a strong bullish trend – you can see higher highs and higher lows forming consistently.
Volume Spike:
The rally after 18:00 came with increasing volume, showing strong buying interest and liquidity injection.
Resistance Zone:
Current price = 3576
The round psychological level is 3580 – 3600 (a possible short-term resistance).
Support / Demand Zone:
Immediate demand zone: 3550 – 3560 (recent consolidation before the breakout).
Deeper support: 3520 – 3530 (if price retraces hard).
📊 Price Action Analysis
Since market is trending up, buying is safer than selling.
A small correction may occur soon (because price is extended), but as long as 3550 holds, the trend remains bullish.
✅ Trading Plan
Buying Area (Best Entries):
3550 – 3560 zone (ideal pullback entry).
If that breaks, 3520 – 3530 is the next strong demand zone.
Selling Area (Short Entries):
Around 3580 – 3600 (short-term resistance, scalp sell possible).
But selling is counter-trend, so take quick profits only.
Trend Bias:
Bullish. Wait for retracements to enter long instead of chasing high candles.
⚠️ Pro Tip:
Mark the 3550 level on your chart – if 5m candle closes strong below it, short-term bearish correction possible. If it holds, next target = 3600+.
إخلاء المسؤولية
لا يُقصد بالمعلومات والمنشورات أن تكون، أو تشكل، أي نصيحة مالية أو استثمارية أو تجارية أو أنواع أخرى من النصائح أو التوصيات المقدمة أو المعتمدة من TradingView. اقرأ المزيد في شروط الاستخدام.
إخلاء المسؤولية
لا يُقصد بالمعلومات والمنشورات أن تكون، أو تشكل، أي نصيحة مالية أو استثمارية أو تجارية أو أنواع أخرى من النصائح أو التوصيات المقدمة أو المعتمدة من TradingView. اقرأ المزيد في شروط الاستخدام.