XAUUSD (D1) – نموذج إليوت ABC قيد التنفيذلانا تبيع التخفيض، وانتظر للشراء عند السيولة الرئيسية 💛
ملخص سريع
الإطار الزمني: يومي (D1)
وجهة نظر إليوت: من المحتمل أن يكون السعر يتطور في هيكل تصحيحي ABC بعد ارتفاع قوي
الاستراتيجية: بيع تخفيض الموجة B إلى العرض، والشراء فقط عندما يعود السعر إلى السيولة القوية
السياق: بدأت المعادن الثمينة عام 2026 بقوة، ولكن لا يزال من المتوقع أن تكون هناك تقلبات قصيرة الأجل وتذبذبات إعادة التجميع
الخلفية الأساسية (تدعم الاتجاه الأكبر)
افتتحت الذهب والفضة عام 2026 بزخم قوي، مما أتاح لهما أفضل أداء منذ أواخر السبعينيات. لا تزال غولدمان ساكس متفائلة بشأن المعادن الثمينة وتواصل تسليط الضوء على هدف طويل الأجل عدواني (حوالي 4900 دولار للذهب).
نقطة لانا الرئيسية: يمكن أن يظل دورة الثور طويلة الأجل سليمة، ولكن السوق لا يزال بحاجة إلى تصحيحات صحية لإعادة ضبط السيولة وبناء هيكل جديد.
الوجهة الفنية (D1) – هيكل إليوت ABC
على الرسم البياني اليومي، بعد القمة القوية، انخفض الذهب بشكل حاد، مشكلاً موجة A واضحة. الهيكل الحالي يشير إلى:
الموجة B: ارتداد تصحيحي إلى المقاومة/العرض
الموجة C: حركة محتملة للأسفل إلى مناطق السيولة قبل تأكيد الاتجاه الكبير القادم
يساعد هذا العدسة ABC في تجنب الانحصار عندما تبدو الأخبار متفائلة، لكن السعر لا يزال في مرحلة تصحيحية.
المستويات الرئيسية من الرسم البياني
1) منطقة البيع (عرض موجة B)
بيع: 4435 – 4440
تتوافق هذه المنطقة مع المقاومة المميزة وتجمع سحب فيبوناتشي (0.236 / 0.382). إذا عاود السعر الارتداد هنا وأظهر الرفض، فهي منطقة قوية للبحث عن ضغط بيع من موجة B.
2) منطقة الشراء (السيولة الرئيسية – احتمال اكتمال الموجة C)
شراء السيولة: 4196 – 4200
هذه هي أقوى منطقة سيولة في الرسم البياني. إذا لعبت الموجة C، ستبحث لانا عن فرص شراء هنا مع تحكم أوضح في المخاطر.
3) تجميع أعمق للسيولة
تجميع السيولة: منطقة التجميع السفلية الموضحة على الرسم البياني
إذا قام السوق بجرف أعمق مما هو متوقع، فإن هذه هي المنطقة التي قد يدخل فيها المشترون على المدى الطويل.
خطة التداول (نهج لانا)
الفكرة الأساسية: بيع الارتفاعات إلى 4435–4440 إذا أظهر السعر ضعفاً (رفض الموجة B).
خطة الشراء الأساسية: الانتظار حتى يعود السعر إلى 4196–4200 ويؤكد الدعم (امتصاص السيولة).
إذا اخترق السعر واحتفظ فوق منطقة البيع، تتوقف لانا عن البيع وتنتظر تشكيل هيكل جديد.
ملاحظة حول سلوك بداية العام
تجلب الأسابيع الأولى من العام غالباً حركات "فوضوية" حيث تعود السيولة ويتم إعادة ضبط الوضع. ستتداول لانا فقط في المناطق المخطط لها وتتجنب المداخل في منتصف النطاق.
هذه هي وجهة نظر لانا الشخصية للسوق وليست نصيحة مالية
موجات إليوت

Has XAUUSD gone down to 3,862?📌 المقدّمة:
السلام عليكم ورحمة الله وبركاته…
أهلاً بكم يا أصدقاء، اليوم راح أشرح لكم بشكل سريع وبسيط آخر تحديث لتحليل الذهب باستخدام موجات إليوت، حتى تكون الصورة واضحة لكم وين ممكن يتحرك السعر خلال الفترة الجاية.
**📉 الشرح المبسّط المختصر – بصيغة كأنك أنت تشرح:
حبايب، حالياً الذهب وصل إلى نهاية موجة تصحيحية كبيرة من نوع WXY.
إحنا هسه نشوف الموجة X اكتملت فوق، وبدا السعر يقدّم إشارات ضعف واضحة، خصوصاً بعد ما لامس الحد العلوي للقناة.
المتوقع بالفترة الجاية إنه السعر يدخل بالموجة Y الهابطة، واللي هدفها النهائي يكون قريب من 3860 تقريباً—هذا مستوى مهم ومتوافق مع قاع القناة السفلية.
باختصار:
الصعود اللي صار يعتبر موجة تصحيحية فقط.
الهبوط القادم متوقع يكون أقوى.
الهدف الرئيسي حوالين 3,862.
وهذا السيناريو يبقى فعّال طالما السعر ما يرجع يغلق فوق قمة موجة X الأخيرة.
📌 الخاتمة:
وبهذا نكون خلّصنا الشرح بشكل سريع وواضح. إذا عندكم أي سؤال أو تحبّون تحليل تفصيلي أكثر، أكتبولي وأنا حاضر.
والسلام عليكم ورحمة الله وبركاته 🌿✨
PEPPERSTONE:XAUUSD PEPPERSTONE:XAUUSD OANDA:XAUUSD CFI:XAUUSD FX:XAUUSD ICMARKETS:XAUUSD FPMARKETS:XAUUSD FXOPEN:XAUUSD FX_IDC:XAUUSD TVC:GOLD CAPITALCOM:GOLD

ذهب على مذة قريب اين ؟؟؟؟ السلام عليكم ورحمة الله وبركاته
اليوم راح أشرح لكم بشكل مختصار وبسيط التحليل الموجي اللي بالصورة، وكإنه أنا واقف قدّامكم أقدّم شرح سريع وواضح.
حاليًا الذهب يتحرّك داخل **قناة صاعدة**، وكل حركة داخله مرقّمة على طريقة إليوت.
بالبداية الذهب خلّص خمس موجات صاعدة وكوّن **موجة (A)**، وبعدها نزل بثلاث موجات تصحيحية وسوّى **موجة (B)**.
من هذي النقطة رجع صعد بموجات جديدة: (1) (2) (3) (4)، وهسه رايح يكمل **الموجة (5)** الأخيرة بالصعود.
الهدف المتوقع للموجة (5) قريب من:
4298**
4329**
وهذي المنطقة تتوقع تكون **نهاية الصعود**.
بعد ما يوصل لهناك، المفروض يكمل **موجة (C)** كبيرة باتجاه الهبوط، والهبوط ممكن يوصل لأسفل القناة، يعني تصحيح قوي.
**الخلاصة:**
الذهب الآن يكمل موجة أخيرة بالصعود، وإذا لمس منطقة الهدف احتمال ينعكس ويبدأ هبوط قوي لأن دورة الموجة توصل نهايتها.
**تحياتي لكم جميعاً، وأتمنى تكون الفكرة وصلت بكل وضوح.**

ما هو مصير نفط في وضع اقتصادي حالي ؟؟؟؟السلام عليكم ورحمة الله وبركاته
هذا تحليل موجي مبسّط لحركة النفط خلال الفترة القادمة. النموذج اللي واضح أمامنا يمشي ضمن قناة هابطة من فترة طويلة، وبنفس الوقت الترقيم يوضح إننا حالياً داخل مسار تصحيحي كبير من نوع A – B – C.
الموجة A اكتملت، وبعدها صار صعود تصحيحي شكّل موجة B، والهبوط اللي دا نشوفه الآن داخل الموجة C الأكبر.
السيناريو المتوقع هو استمرار النزول للمستويات القريبة من: 42.71
وبعدها ممكن نشوف ارتداد بسيط يشكّل تصحيح داخل الموجة الرابعة الفرعية، وبعدها يكمل هبوطه للموجة الخامسة ضمن C حتى يكمل النموذج بالكامل.
بشكل عام الاتجاه العام يبقى هابط إلى أن تنتهي الموجة C تماماً.
هذا توضيح بسيط حتى الصورة تكون واضحة بدون تعقيد.

رجعنا مع ذهب بعد غياب فترة طويل ما هو مصير ذهب !!!!سلام عليكم ورحمة الله وبركاته
أحب أشارك وياكم هذا التحليل الموجي للذهب بشكل مختصر وواضح. حالياً السعر داخل حركة تصحيح طبيعي ضمن الموجة الرابعة IV بعد صعود قوي بالموجة الثالثة.
الهبوط اللي نشوفه الآن يعتبر تصحيح فقط، والمناطق المتوقعة لنهاية الموجة IV تكون تقريباً بين:
3,869 - 3,819 - 3,769
بمجرد ما يكمل التصحيح داخل هذي المناطق، يتوقع بإذن الله يبدأ الذهب يرتد ويصعد باتجاه الموجة الخامسة V، واللي أهدافها المحتملة تكون بين:
4,523 - 4,693
- بشكل عام الاتجاه الرئيسي يبقى صاعد بعد انتهاء هذا التصحيح.
- هذا توضيح بسيط حتى تكون الصورة واضحة للجميع.

السوق السعودي استمرارية الموجة الثالثة على الفاصل السنوي.من يقرأ الشارت السنوي لمؤشر السوق السعودي تاسي (TASI) بعين فاحصة يدرك أن ما نراه اليوم ليس قمة دورة صعود، بل مرحلة متقدمة من الموجة الثالثة الكبرى، التي ما زالت ممتدة منذ قاع عام 2009 وحتى اليوم. هذه الموجة تمثل تحولًا تاريخيًا في طبيعة السوق، إذ لم تعد حركة الأسعار انعكاسًا للسيولة فقط، بل نتيجة مباشرة لتغير هيكلي في الاقتصاد السعودي نفسه.
الموجة الأولى الكبرى ظهرت منذ منتصف التسعينات، عندما وُلدت السوق بشكلها الحديث، وانتهت عند قمّة عام 2006، لتأتي بعدها الموجة الثانية التصحيحية التي استمرت حتى 2009، حيث وصل المؤشر إلى أدنى مراحله النفسية والاقتصادية. من ذلك القاع انطلقت الموجة الثالثة — موجة التحول — التي ما تزال تتنفس حتى اللحظة.
الشموع السنوية الطويلة المتصلة على الرسم العام تؤكد أننا داخل موجة ثالثة ممتدة، لم تُظهر حتى الآن أي ملامح ضعف أو تصحيح هيكلي يمكن اعتباره بداية للموجة الرابعة. كل التراجعات التي حدثت منذ قمّة 2022 إلى اليوم ما هي إلا موجات فرعية داخل الثالثة الكبرى، أقرب إلى عمليات إعادة تموضع للسيولة لا أكثر.
هذه الموجة الثالثة تتناغم بشكل لافت مع ما يعيشه الاقتصاد السعودي من توسع فعلي؛ فالمشاريع العملاقة، والتحول الصناعي، والانفتاح على الاستثمار الأجنبي، كلها تشكّل الوقود الحقيقي لاستمرارية الاتجاه الصاعد على المدى الطويل. السوق يعكس اقتصادًا في حالة بناء، لا اقتصادًا في حالة تشبّع.
أما النفط — وفق التحليل المرفق على الرسم الخاص بـ USOIL — فيمرّ حاليًا بالموجة الثالثة الكبرى بعد موجة انتهاء الوجة الأولى و الثانية الممتدة من قاع كارونا و حتى عام ٢٠٢٢ . وهذه الموجة الثالثة ليست نهاية الاتجاه، بل تمهيد للانطلاقة الأخيرة في الموجة الخامسة، والتي يُتوقع أن تُعيد الأسعار إلى مستويات مرتفعة خلال العقد القادم.
في الجهة المقابلة تشهد السوق العقارية حاليا ركودا نتيجة القرارات الحكيمة التي اتخذتها القيادة للحد من كبح جماح شجع العقارين و تجار التراب و هذا الركود ما هو الا استعداد للانهيار العضيم و بداية الموجة ABC و التي لن تقل عنفا عن الموجات الصاعدة السابقة, و هو ما يعني هروب السيولة النقدية من هذه السوق إلى سوق الاسهم.
بعبارة أخرى:
السوق السعودي يعيش بداية الموجة الثالثة التاريخية، بينما النفط يتهيأ لبناء الخامسة، والنتيجة المتوقعة خلال العقد القادم هي تداخل موجتين صاعدتين — اقتصاد حقيقي يتمدد، وسوق مالي يعيد تسعير ذاته على أسس جديدة.
الشارت السنوي يروي هذه القصة بوضوح. لم نصل بعد إلى قمّة الموجة الثالثة، ولم تبدأ الرابعة بعد. إننا ببساطة نعيش ذروة النبض، اللحظة التي تتقاطع فيها الموجات الاقتصادية والفنية لتصنع ما يمكن أن يكون أعظم دورة توسّع في تاريخ السوق السعودي.

الذهب و ماذا بعد؟
مقدمة
في عام ٢٠٢٠، وبينما كان العالم غارقًا في فوضى الجائحة والركود والانهيارات، اتخذتُ قرارًا لم يكن مبنيًا على الخوف بل على الرؤية: التحمّل في الذهب. في ذلك الوقت، كان المزاج العام متشائمًا، ولكن النماذج الفنية – وتحديدًا موجات إليوت – كانت تروي قصة مختلفة. كنت أرى أن الذهب يقف عند بداية موجة صاعدة كبرى قد تقوده إلى ما يتجاوز ٣٢٠٠ دولار للأوقية. مرت السنوات، وتحرك الذهب فعلًا كما توقعت: قفزة تاريخية تجاوزت حاجز الـ٤٠٠٠
دولار. لكن اليوم، ونحن نعيش نهاية موجة ممتدة لعقدين من الزمن، يلوح في الأفق سؤالٌ جديد:
إلى أين بعد كل هذا اللمعان؟ هل دخل الذهب مرحلة تصحيحية كبرى؟ وهل يمكن أن نعود إلى ٢٠٠٠ دولار أو حتى ١٠٠٠ دولار؟
في هذه المقالة سأحاول قراءة المشهد من ثلاثة زوايا متكاملة:
السياسة الاقتصادية.
الجيوسياسة العالمية.
التحليل الفني عبر موجات إليوت.
الجزء الأول: الذهب في مرآة التاريخ
منذ أن تخلّى العالم عن معيار الذهب في ١٩٧١، أصبح المعدن الأصفر مرآةً للثقة والاضطراب.
ففي كل أزمة، يتجه العالم إليه وكأنه الصندوق الأسود للنظام المالي.
في السبعينات، قفز الذهب من ٣٥ إلى ٨٥٠ دولار مع صدمات النفط والتضخم.
في ٢٠٠٨، الأزمة المالية العالمية أطلقت موجة جديدة أوصلته إلى ١٩٠٠ دولار.
في ٢٠٢٠، الجائحة وضخ السيولة الهائل أعاد إشعال الموجة الكبرى التي حملتنا نحو مستويات الـ٤٠٠٠ دولار.
لكن التاريخ يعلمنا أن كل دورة صعودية عظيمة يتبعها تصحيح زمني طويل، يُعيد ترتيب المشهد ويغربل المستثمرين.
الجزء الثاني: الاقتصاد الكلي… الرياح التي تحرك الذهب
1. الفائدة الحقيقية والدولار
العلاقة بين الذهب وسعر الفائدة الحقيقية علاقة عكسية لا تخطئها العين.
فحين تكون الفائدة الحقيقية (الفائدة الاسمية مطروحًا منها التضخم) منخفضة أو سالبة، يلمع الذهب كأصل لا يُستهلك ولا يعطي فائدة لكنه يحافظ على القيمة.
أما اليوم، ومع دورة رفع الفائدة الأمريكية الأخيرة، بدأ هذا التوازن يتبدل.
قوة الدولار وارتفاع العوائد الحقيقية تعني أن الذهب قد بدأ يواجه رياحًا معاكسة.
لذا، من الطبيعي أن يبدأ الذهب بتصحيح جزئي أو حتى عميق مع انحسار موجة السيولة العالمية.
. التضخم والتيسير النقدي
بين ٢٠٢٠ و٢٠٢٣، ضخّت البنوك المركزية تريليونات الدولارات في الاقتصاد.
هذه الأموال رفعت كل شيء: الأسهم، العقار، وحتى الذهب.
لكن مع انحسار التضخم الآن، ومع تحوّل السياسة النقدية إلى التشدد، بدأ اللمعان يبهت تدريجيًا.
3. الطلب من البنوك المركزية
البنوك المركزية، خصوصًا في آسيا والشرق الأوسط، اشترت كميات ضخمة من الذهب في السنوات الأخيرة كتحوّط من الدولار.
هذا العامل هو الحصن الأخير أمام أي انهيار سعري.
لكن إن بدأ هذا الطلب بالتباطؤ أو التوقف، فذلك يعني أن الذهب قد يدخل في دورة تصحيحية قد تمتد سنوات.
الجزء الثالث: الجيوسياسة… الوقود العاطفي للسوق
الجيوسياسة هي اليد الخفية التي تعيد كتابة قواعد العرض والطلب على الذهب.
كلما اقترب العالم من صراع جديد، ارتفعت الأسعار حتى دون مبرر اقتصادي.
لكن الآن، وبعد موجة من النزاعات (أوكرانيا، الشرق الأوسط، تايوان)، يبدو أن الذهب استنفد جزءًا كبيرًا من علاوة الخوف.
إذا هدأت الجبهات وتراجعت المخاوف من توسع الحروب، فإن الذهب سيفقد جزءًا من بريقه كملاذ آمن، وهذا يعني مزيدًا من الضغط على الأسعار.
إضافة لذلك، التوجه نحو العملات الرقمية للبنوك المركزية (CBDC) قد يخلق نوعًا جديدًا من الملاذات “الرقمية”، مما يُقلّل الحاجة للمعدن في المدى البعيد.
الجزء الرابع: الموجات تقول كلمتها (تحليل إليوت)
في الرسم المرفق، نرى بوضوح أن الموجة (5) من الدورة الكبرى للذهب وصلت إلى قمتها عند 4,381 دولار.
هذا يشير إلى نهاية دورة ممتدة منذ ٢٠٠١.
الآن نبدأ ما يسميه إليوت: الموجة التصحيحية الكبرى (A-B-C).
وهذه ليست حركة عشوائية، بل تصحيح زمني وسعري متكامل قد يمتد سنوات.
🔹 أهداف الموجة (A):
من الصورة، مستويات فيبوناتشي الأساسية تشير إلى:
0.382 عند 3,107 دولار
0.5 عند 2,714 دولار
0.618 عند 2,320 دولار
بالتالي، الموجة (A) يُتوقع أن تنتهي ضمن نطاق دولار.
هذه المنطقة تمثل التصحيح الطبيعي الأول بعد موجة صعود امتدت لسنوات.
🔹 الموجة (B):
بعد انتهاء الموجة (A)، سيبدأ الذهب موجة ارتدادية نحو الأعلى، وهي عادةً بين 38% إلى 62% من طول الموجة (A).
بالتالي، نتوقع أن تعود الأسعار إلى نطاق قبل استئناف الهبوط.
الموجة (C):
هي المرحلة الأكثر ألمًا للمستثمرين، وغالبًا تمتد بنفس طول الموجة (A) أو أكثر.
حسب الفريم السنوي والقياسات الطويلة المدى، الموجة (C) قد تستهدف:
نسبة فيبوناتشي الهدف التقريبي التفسير
0.382 2,804 دولار تصحيح معتدل
0.5 2,316 دولار تصحيح متوسط
0.618 1,829 دولار تصحيح عميق
امتداد ~1,000 دولار تصحيح نادر وطويل الأمد
بالتالي، السيناريو الذي أراه الآن – بناءً على الموجة الكبرى – هو عودة الذهب نحو 2000 دولار، وربما في نهاية الدورة الطويلة نلمس 1000 دولار إذا توفرت الظروف الاقتصادية المناسبة لذلك (ارتفاع الفائدة الحقيقية + قوة الدولار + تباطؤ الطلب العالمي).
الجزء الخامس: قراءة متعددة الأطر الزمنية
الإطار الزمني نهاية (A) محتملة نهاية (C) محتملة المدة الزمنية
يومي (1D) 3,600 – 3,750 — تصحيح قصير المدى
أسبوعي (1W) 3,450 – 3,240 ~3,000 تصحيح متوسط
شهري (1M) 2,710 – 2,320 ~2,000 تصحيح طويل
سنوي (12M) 2,316 – 1,829 ~1,800 – 1,000 تصحيح نهائي طويل جدًا
هذا التدرج الزمني يؤكد أننا بدأنا مرحلة تصحيحية كبرى قد تمتد من 2025 إلى 2030.
الجزء السادس: العوامل التي قد تسرّع أو تبطئ الموجة التصحيحية
🔻 عوامل تُسرّع الهبوط:
استمرار رفع الفائدة الأمريكية.
انحسار التضخم إلى مستويات دون ٢%.
ارتفاع الدولار إلى قمم جديدة.
توقف البنوك المركزية عن شراء الذهب.
استقرار سياسي عالمي يقلّل الطلب على “الملاذات الآمنة”.
🔺 عوامل تُبطئ الهبوط أو تعكسه:
اندلاع صراعات جديدة (تايوان / الخليج / أوروبا الشرقية).
أزمة ديون أمريكية أو فقدان الثقة في سندات الخزانة.
توسع التيسير الكمي مجددًا.
انهيار سوق الأسهم أو العقار مما يدفع المستثمرين للذهب كتحوّط.
الجزء السابع: من منظور المستثمر (الآن ماذا أفعل؟)
من وجهة نظر عملية، من يملك الذهب منذ ٢٠٢٠ مثلي، لديه الآن خيارات ثلاث:
الاحتفاظ الذكي:
الاحتفاظ بالذهب كتحوّط استراتيجي دون البيع الكامل، مع التحوّط بأدوات أخرى مثل السندات القصيرة الأجل أو النقد.
التخفيف الجزئي:
بيع جزء من المركز عند كل ارتداد (B) متوقعة، وإعادة الشراء قرب مناطق ٢٧٠٠ أو ٢٣٠٠.
إعادة التوزيع الذكي:
نقل بعض رأس المال إلى أصول غير مترابطة (طاقة، شركات مناجم، صناديق تحوّط).
الجزء الثامن: رؤية معاكسة يجب ألا نتجاهلها
رغم أنني أرى الذهب في مسار تصحيحي طويل، يجب أن أقرّ أن بعض المؤسسات العالمية تحمل رؤية مغايرة:
Goldman Sachs تتوقع استمرار الصعود حتى ٤٥٠٠ دولار منتصف ٢٠٢٦.
J.P. Morgan ترى أن الطلب المركزي سيبقي الأسعار مرتفعة فوق ٣٥٠٠ دولار.
World Gold Council يحذر من نقص المعروض المعدني عالميًا

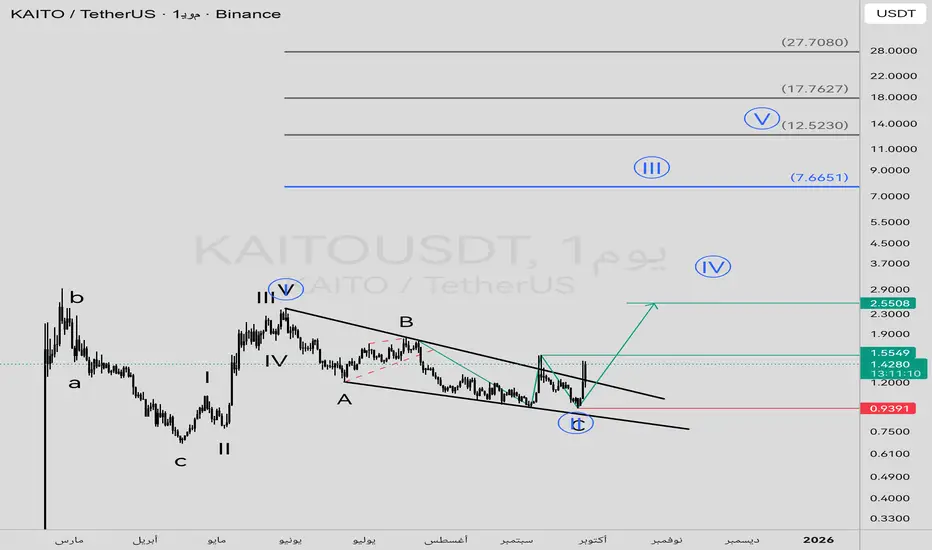
وتد هابط و دبل قاع نموذجين ايجابيه و بإذن الله عندنا موجة ثالثه من موجات اليوت تستهدف منطقة 7 دولار و بالتوفيق للجميع
الفضة: الموجة الخامسة تقترب من نهايتها وسط تقلبات محتملةالفضة: الموجة الخامسة تقترب من نهايتها وسط تقلبات محتملة
شهدت صعودًا حادًا خلال يومين رفع الأسعار الفورية إلى 43.09 دولار، وهو أعلى مستوى جديد للحركة.
هذا يعني أن قمة يوم الثلاثاء عند 42.97 دولار كانت نهاية الموجة 3 من 5، وأن الهبوط إلى 41.14 دولار، وهو أدنى مستوى في 17 سبتمبر، كان يمثل الموجة 4 .
أما الارتفاع الحالي فيُعد الموجة 5 من 5 .
الأسعار عادت الآن إلى خط الاتجاه العلوي لقناة الموجة 5، ولكن إذا كانت الموجة 5 مساوية في الحجم للموجة 1 ، وهو أكثر العلاقات الموجية شيوعًا في الموجات الدافعة – فقد تقفز الفضة إلى 43.66 دولار ، هذا الاندفاع ليس إلزاميًا، لكن إن حدث فسنعتبره اختراقًا وهميًا ، وهو امتداد سريع لكن قصير نسبيًا فوق خط الاتجاه العلوي للقناة، وغالبًا ما يشير إلى نهاية الحركة.

الذهب الموجة (4) على الأبواب أم صعود إلى 3803 دولار؟الذهب الموجة (4) على الأبواب أم صعود إلى 3803 دولار؟
1️⃣ السيناريو الأساسي :
☑️ ارتفع الذهب بالتوازي مع الفضة نهاية الجلسة يوم الجمعة ، لكنه لم يؤكد القمة الجديدة للفضة و يظل أقصى مستوى حديث للذهب عند 3707.65 دولار، وهو أعلى مستوى خلال اليوم الأربعاء 17 سبتمبر.
☑️ يوضح الرسم البياني أن قمة يوم الأربعاء تمثل الموجة 5 من (3). في هذا السيناريو، من المفترض أن يظل الذهب دون قمة الأربعاء، وأن يبدأ في التراجع الأسبوع القادم مع بداية الموجة (4).
☑️ ستكون الموجة (4) عبارة عن تصحيح جزئي للموجة (3) ، ما سيؤدي إلى هبوط الذهب خلال الأسابيع القادمة ويكون الهدف قصير المدى للهبوط يتمحور حول 3556 دولار ، مع احتمالية هبوط أكبر بعد ذلك.
2️⃣ السيناريو البديل :
☑️ إن الموجة 4 انتهت عند 3268.18 دولار في 30 يوليو، بدلاً من 20 أغسطس .
☑️ في هذا السيناريو يكون قمة 3707.65 دولار يوم الأربعاء تمثل قمة الموجة 3 فرعية من 5 ، بينما يمثل القاع 3627.97 دولار يوم الخميس 18 سبتمبر الموجة 4 فرعية من الموجة 5 ، ومن المتوقع أن تدفع الذهب إلى نطاق 3775 – 3803 دولار قبل أن تنتهي.
☑️ طالما لم يتجاوز سعر الذهب 3707.65 دولار، سيبقى السيناريو البديل أقل احتمالية

تحليل us500🔹 التحليل الفني (Technical)
• المؤشر يتحرك داخل قناة صاعدة (زرقاء).
• السعر الآن عند 6,661 قريب من سقف القناة (6,670 – 6,700).
• وجود مناطق FVG عند 6,620 – 6,580، والتي قد يجبر السعر على العودة لإغلاقها.
• الزخم الإيجابي ما زال قائم لكن مع تشبع شرائي واضح.
⸻
🔹 التحليل الموجي (Elliott Waves)
• الموجة الحالية تبدو كموجة خامسة صاعدة ضمن موجة أكبر.
• قرب اكتمال الموجة عند 6,670 – 6,700، بعدها يُرجح الدخول في تصحيح A-B-C هابط باتجاه 6,600 – 6,540.
⸻
🔹 التحليل الزمني (Time Cycles)
• الدورة الزمنية الصاعدة بدأت من 17 سبتمبر، ومن المتوقع بلوغ القمة بين (22 – 23 سبتمبر).
• بعد هذه الفترة قد نشهد بداية هبوط تصحيحي.
⸻
🔹 التحليل الأساسي (Fundamentals)
• الأسواق الأمريكية مدعومة بتوقعات تخفيف تشديد الفيدرالي مع تباطؤ التضخم.
• ولكن أي بيانات سلبية (CPI, PMI, قرارات الفائدة القادمة) قد تضغط على المؤشر بقوة.
• ارتفاع العوائد على السندات قد يشكل مقاومة للنموذج الحالي.
⸻
🔹 التحليل الرقمي (Quantitative)
• المستويات الرقمية المهمة:
• Pivot Zone (6,620 – 6,630) المنطقة المحورية الحالية.
• Support: 6,600 – 6,580 – 6,540
• Resistance: 6,670 – 6,700 – 6,740
⸻
🔹 البرايس أكشن (Price Action)
• الشموع الأخيرة قوية صاعدة لكن مع رفض قرب 6,660.
• أي إغلاق تحت 6,620 يعطي إشارة بداية تصحيح.
⸻
🔹 النماذج الفنية (Chart Patterns)
• احتمالية تكوين Double Top عند 6,670.
• القناة الصاعدة تدعم استمرار الاتجاه العام، لكن قرب خط المقاومة العلوي.
⸻
🔹 النماذج الرقمية
• تكرار المستويات 6,660 – 6,670 يشير إلى كونها منطقة انعكاس محتملة.
⸻
🔹 نماذج الهارمونيك (Harmonic)
• هناك ملامح تكوين نموذج Bearish Gartley أو Bat عند المنطقة (6,670 – 6,700).
• تأكيد النموذج يكون بكسر 6,620.
⸻
🔹 المنطقة المحورية (Pivot Zone)
• 6,620 – 6,630 هي المفتاح: فوقها استمرار صعود، تحتها بداية تصحيح.
⸻
🔹 نقاط التثبيت (Fixation Levels)
• أعلى تثبيت: 6,700
• أدنى تثبيت: 6,540
⸻
✅ التوصية
• قصير المدى (Intraday): بيع من قرب 6,670 – 6,700 مع وقف خسارة فوق 6,730، وأهداف 6,620 – 6,580.
• متوسط المدى (Swing): انتظار كسر 6,540 لتأكيد بداية هبوط أعمق.
• السيناريو البديل: في حال اختراق 6,700 والإغلاق فوقه → استمرار الصعود نحو 6,740 – 6,800
ملاحظة هامة
نحن لانقدم لك نصائح مالية واستثمارية
بل نقدم لك محتوى علمي وثقيفي
انت شخص الوحيد المسؤل عن ضغط زر الييع والشراء
المحلل
المهندس ايهاب
قناة سيد الذهب

الفضة بعد اختبار القمة📌 الفضة بعد اختبار القمة
ارتفعت الفضة أول أمس إلى مستوى 42.97 دولار لتلامس الحد العلوي لقناة الموجة (5) .
🔎 هناك احتمالان رئيسيان:
1️⃣ أن تكون قمة اول أمس قد شكلت نهاية الموجة 5، وبالتالي بداية تصحيح قد يستمر لأسابيع أو أشهر.
2️⃣ أو أن التراجع الحالي مجرد جزء من الموجة iv، مما يعني أن الفضة قد تسجل قمة قصيرة جديدة مع الموجة v لاحقًا.
📉 الدعم الحالي: 40.40 – 40.68 دولار
❌ كسر هذا النطاق والإغلاق دونه سيدعم سيناريو الهبوط.

مؤشر الدولار الأمريكي بين سيناريوهين متناقضين💵 مؤشر الدولار الأمريكي بين سيناريوهين متناقضين
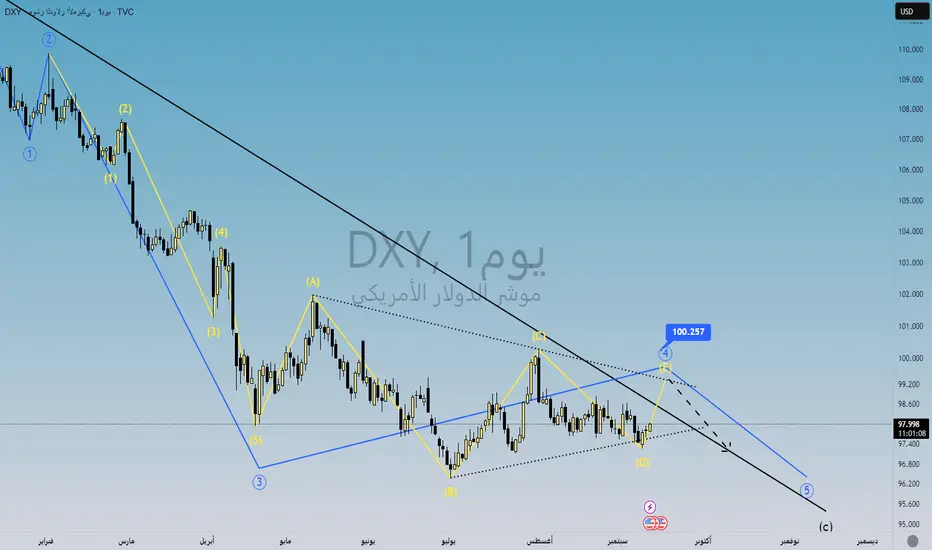
مؤشر الدولار الأمريكي عالق في نطاق عرضي طوال الأسبوع الماضي، مع سيناريوهين محتملين: إما هبوط نحو قيعان جديدة قبل صعود قوي، أو بداية موجة صعود ممتدة إذا اخترق مستوى 100.257.
ظل مؤشر الدولار الأمريكي (DXY) يتداول في نطاق عرضي طيلة الأسبوع الماضي دون تطورات جديدة تغير النظرة قصيرة الأجل. ولا تزال السيناريوهات السابقة قائمة:
السيناريو الأول: أن المؤشر اقترب من نهاية الموجة (D) من الموجة الرابعة (دائرة)، حيث تتخذ الموجة الرابعة شكل مثلث جاري. ومن المتوقع أن تدفع الموجة (E) المؤشر صعودًا بشكل طفيف نحو منطقة 99.00 ، عندها تكتمل الموجة الرابعة، ليبدأ المؤشر بعدها الموجة الخامسة هبوطًا إلى قيعان جديدة، منهياً الموجة المتوسطة (C)، يعقبها صعود قوي.
السيناريو الثاني: أن الموجة المتوسطة (C) قد انتهت بالفعل عند 96.377 (قاع 1 يوليو). وفي هذه الحالة، يكون المؤشر على وشك بدء موجة صعود كبيرة تمتد عدة أشهر. ويؤكد هذا السيناريو الإيجابي إغلاق المؤشر فوق 100.257 (قمة 1 أغسطس)، ما قد يفتح المجال أمام ارتفاعات قوية لاحقة.

مؤشر S&P 500 في الموجة الخامسة📊 مؤشر S&P 500 في الموجة الخامسة
مؤشر S&P 500 أنهى الموجة الرابعة عند 6360 في 2 سبتمبر، وبدأ الموجة الخامسة مثل ناسداك، مع هدف محتمل عند 6760 نقط. 🚀

ناسداك 100 يواصل الصعود في الموجة الخامسة💻 ناسداك 100 يواصل الصعود في الموجة الخامسة
مؤشر ناسداك 100 يواصل الصعود في الموجة الخامسة منذ 2 سبتمبر، محققًا قممًا جديدة ، مع هدف محتمل قرب 24640 نقطة قبل انعكاس الاتجاه. ⚠️

الفضة تتفوّق على الذهب بارتفاع 50%⚪️ الفضة تتفوّق على الذهب بارتفاع 50%
أظهرت الفضة أداءً متفوقاً على الذهب، إذ ارتفعت بنسبة 50% منذ 7 أبريل، بينما اكتفى الذهب بزيادة قدرها 22% فقط. ويُعد هذا الصعود أكبر من مكاسب مؤشر داو جونز (21%)، وستاندرد آند بورز 500 (30%)، وناسداك 100 (38%).
كنا قد أشرنا سابقاً إلى نطاق مستهدف قصير المدى للفضة عند 42.32 دولار، وقد سجّل هذا الهدف يوم الجمعة الماضية .
تشير التقديرات إلى أن الموجة الخامسة من (5) ربما تكون قد انتهت عند هذه المستويات، أو أن الموجة 3 من الخامسة قد بلغت قمتها.
ووفقاً للسيناريو الأساسي، تبدأ الموجة 4 قريباً كتصحيح جزئي للموجة 3 التي بدأت من 36.97 دولار (قاع 20 أغسطس). وإذا كان ارتفاع يوم الجمعة الماضي يمثل نهاية الموجة 3 ، فإن الهدف المبدئي للموجة 4 سيكون حول 40.36 دولار. أما إذا لم تكتمل الموجة 3 بعد، فسيتغيّر هدف الموجة 4 تبعاً للقمة النهائية.

الذهب ما زال داخل نطاق متذبذب الذهب ما زال داخل نطاق متذبذب
ارتفعت أسعار الذهب خلال التداولات اللحظية لتسجل مستوى 3674.80 دولار، وهو الحد الأعلى للنطاق المستهدف بين 3600 و3673 دولار. وقد جاء هذا الارتفاع يوم الثلاثاء 9 سبتمبر وتم الإشارة لهذا الصعود في تحليلات يوم 1 سبتمبر .
الموجات الخامسة عادة ما تكون قوية في المعادن الثمينة، مما يعزز التوقعات الصعودية ، وتشير التحليلات إلى أن خط القناة العلوي للموجة الثالثة يمر بنطاق 3775–3803 دولار خلال الأسبوعين المقبلين.
وعند مستوى 3778 دولار ستعادل الموجة الخامسة حجم الموجة الأولى، وهو النمط الأكثر شيوعاً في الحركات الاندفاعية.
2️⃣ سيناريو بديل :
إذا كانت الموجة الرابعة قد اتخذت شكل مثلث تقليدي انتهى في 30 يوليو، فإن القمة المسجّلة يوم الثلاثاء الماضي قد تمثل الموجة الثالثة 3 من الموجة الخامسة 5 ، بعدها يُتوقّع هبوط قصير المدى (الموجة الرابعة 4) نحو 3592 يليه صعود جديد (الموجة الخامسة 5) نحو الأهداف المذكورة.

تحليل قصير المدى لمؤشر الدولار الأمريكي (DXY)💵 تحليل قصير المدى لمؤشر الدولار الأمريكي (DXY)
التحليل قصير المدى لا يزال ساريًا، مع سيناريوهين محتملين:
1️⃣ سيناريو الهبوط المؤقت (الأرجح حاليًا):
المؤشر أنهي الموجة الدقيقة (D) من الموجة الرابعة والتي تتخذ شكل مثلث جاري (Running Triangle).
الموجة (E) صاعدة بشكل محدود، تنتهي تحت 100.257 (قمة 1 أغسطس)، لتكتمل الموجة الرابعة .
بعد ذلك تبدأ الموجة الخامسة وهي موجة هابطة تتجه بالدولار نحو مستويات أدنى من 96.377 (قاع 1 يوليو).
اكتمال خمس موجات سينهي الموجة المتوسطة (C) ويمهد لأكبر صعود للدولار منذ قمة سبتمبر 2022.
2️⃣ السيناريو الصاعد البديل:
إذا كان قاع 1 يوليو قد أنهى بالفعل الموجة المتوسطة (C)، فإن أي ارتفاع فوق 100.257 سيدعم هذا الرأي الصاعد ويشير إلى بداية صعود متعدد الأشهر.
🔑 الخلاصة:
الدولار قريب من مرحلة حرجة، والمتابعة ضرورية لتحديد استمرار الهبوط أو بدء صعود طويل الأمد.
تحليل S&P 500 – تحديث الموجات📊 تحليل S&P 500 – تحديث الموجات
وصل المؤشر إلى 6555 بجلسة أمس ، إذا كان هذا الارتفاع يمثل الموجة (3) من 5 دائرية قطرية نهائية فإن :
الموجة (4) ستكون هبوطًا متعدد الأيام نحو 6443 .
يليها سترتفع الأسعار لتسجيل قمة جديدة وإنهاء النموذج لإكمال الموجة 5 دائرية قطرية .
⚠️ المفتاح:ش
أي كسر لمستوى 6360 يلغي السيناريو الصاعد للقطرية ويزيد احتمالية حدوث هبوط أكبر فورًا.

تحليل مؤشر Dow Jones (DJIA)📊 تحليل مؤشر Dow Jones (DJIA)
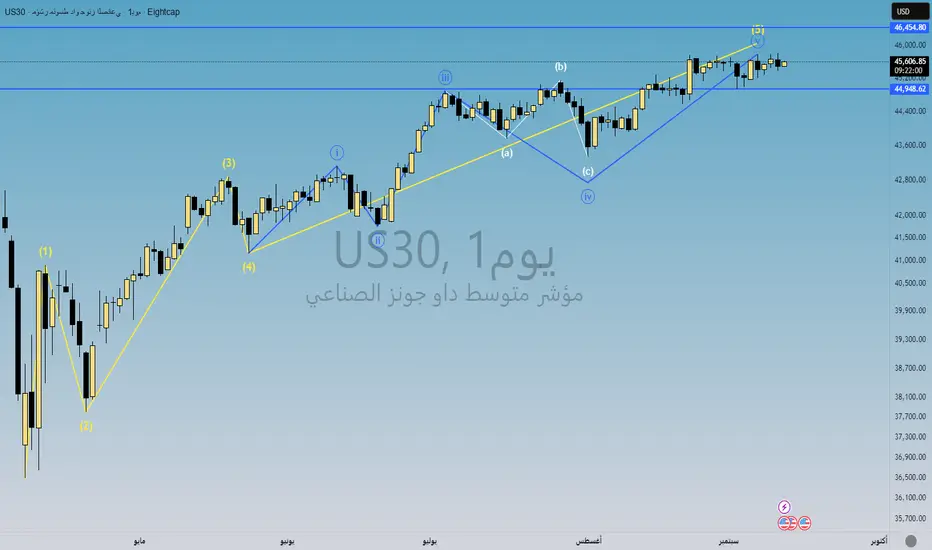
وصل المؤشر إلى 45,770.20 يوم الجمعة الماضي كقمة داخل اليوم.
يوم أمس 10 سبتمبر، حاول المؤشر اختبار هذا المستوى وبلغ 45812 داخل اليوم، وأنهى الجلسة عند 45495 كقمة إغلاق جديدة طفيفة.
🔹 السيناريو الأول:
إذا كانت الموجة الخامسة عند المستويات الحالية قد انتهت، فمن المتوقع أن يبدأ المؤشر بالهبوط.
أي تراجع يكسر 44948.62 (قاع الموجة الرابعة) سيؤكد إمكانية هبوط أكبر.
🔹 السيناريو الثاني:
الموجة الخامسة لم تنتهِ بعد، وأقصى صعود محتمل عند 46,454.80، حيث تبلغ الموجة 5 61.8% من الموجة 1.
تحليل الفضة – تحديث🥈تحليل الفضة – تحديث
صعدت الفضة يوم الاثنين 8 سبتمبر إلى 41.66$ محققة قمة جديدة منذ 14 سنة 🎯
هذه القمة جاءت داخل النطاق المستهدف عند 41.53 – 42.45$.
النمط الموجي يشير لاحتمال الحاجة إلى حركة هبوط – صعود إضافية لإكمال موجة 4 و 5 وذلك لإنهاء الموجة (5) الأكبر درجة .
في حالة صحة هذا السيناريو، قد تصل الفضة إلى الحد العلوي من قناة الموجة (5) حيث يمر خط الاتجاه عند: 42.51$ غدًا .
استمرار القوة الشرائية قد يدفع الأسعار لأعلى.
إشارة سلبية: كسر مستوى 39.13$ سيؤكد بدء الموجة الرابعة (IV) ذات الدرجة الأكبر في اتجاه هابط قصير المدي .
🔑 الخلاصة:
الاتجاه العام ما زال صاعدًا، لكن يلزم الحذر من أي كسر لمستوى 39.13$.
أشرنا في تحديث قصير المدي يوم الثلاثاء ان اول دعم علي المدي القصير للصعود هو 40.31 ونلاحظ حافظت على دعم 40.31$، مما يبقي الصعود نحو أهدافنا قائمًا ما دامت محافظة علي هذا الدعم .

تحليل الذهب – تحديث🥇📈 تحليل الذهب – تحديث
صعد الذهب يوم الثلاثاء حتى 3674.80 محققًا قمة النطاق المستهدف 3600 – 3678$ المشار إليها في تحليلات يوم 1 سبتمبر ✅
الموجة الخامسة قد تكون عند قمة حالية أو قد تمتد نحو 3775 – 3803$ خلال أسبوع ونصف، حيث يمر خط الاتجاه العلوي للموجة (3).
عند 3778$ ستكون الموجة 5 مساوية للموجة 1، وهو أكثر العلاقات شيوعًا في الاندفاعات الموجية.
على المدى القصير: مؤشر الزخم الداخلي بلغ ذروته يوم 3 سبتمبر، ولم يؤكد قمم الذهب الجديدة في 5 و 8 و 9 سبتمبر حتي الأن ، ما قد يصعّب استمرار الصعود ما لم يؤكد المؤشر هذه القمم.
📊 نتابع التطورات أولًا بأول لتأكيد السيناريو القادم.
⚠️ الخلاصة :
رغم وصول الذهب إلى قمة النطاق المستهدف عند 3673$ المشار إليها في تحليل 1 سبتمبر ، إلا أن مؤشرات الزخم لم تؤكد الصعود الأخير.
🔑 الرجاء الحذر من الشراء حاليًا حتى تتضح إشارة تأكيد جديدة.
منطقة 3605 - 3608 تعتبر منطقة جيدة للصعود للقمة مرة أخري في حال لم يتم اختراقها لاسفل والإغلاق أسفلها .

تحليل موجي للفضة - 1 ساعة⚡️تحليل موجي للفضة - 1 ساعة
تشير البنية الداخلية للموجات على الإطار الزمني للساعة إلى أن الفضة قد أنهت بالأمس الموجة الثالثة الفرعية من الموجة الثالثة الكبرى. ومن المرجح أننا الآن داخل مسار تصحيحي للموجة الرابعة الفرعية من الموجة الثالثة الكبرى.
يُعد مستوى 40.82 دعماً مهماً وفرصة مناسبة للشراء، مع ضرورة مراقبة مستوى 40.31 الذي في حال الوصول إليه يُمثل منطقة شراء قوية، ليستهدف السعر مستوى 42.32 كأول محطة صعودية.
يمثل مستوى 39.13 حدًا فاصلًا قصير الأجل بين سيناريو الشراء والبيع؛ حيث إن كسر هذا المستوى قد يُشير إلى بداية الموجة الرابعة (IV) ذات الدرجة الأكبر في اتجاه هابط.
الخلاصة :
يمكن النظر في فتح صفقات شراء للفضة ابتداءً من مستوى 40.31، مع وضع الهدف الأول عند مستوى 42.32. 📈✨
