OPEN-SOURCE SCRIPT
تم تحديثه Volatility Adjusted Momentum Signal ETH (VAMS)
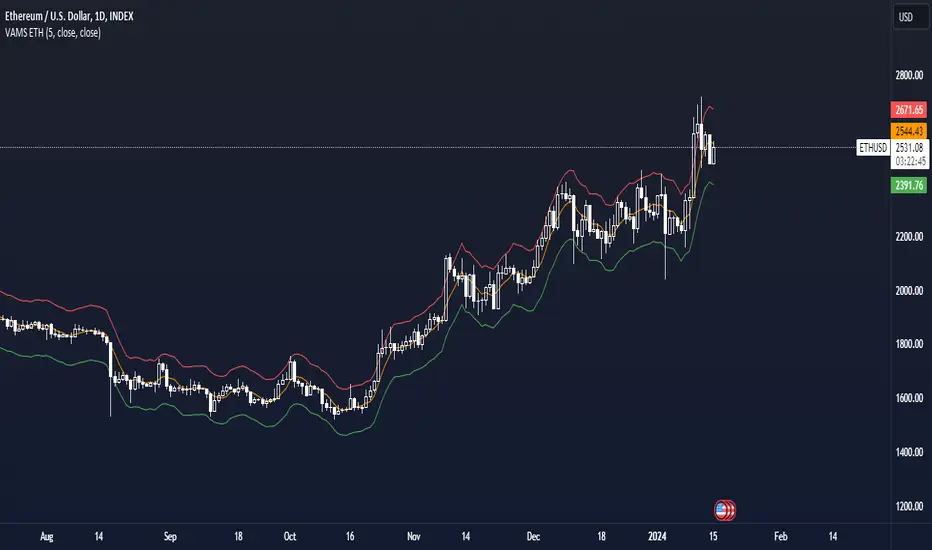
The VAMS ETH indicator is a technical analysis tool designed for Ethereum that aims to provide traders with insights into potential price momentum based on volatility-adjusted price ranges. This indicator is especially useful for identifying periods where the price is likely to experience significant movements away from a defined mean price level.
Key Functions
Volatility Measurement It utilizes a short-term lookback period to measure volatility, calculated as the standard deviation of the closing prices over the user-defined period.
Mean Price Calculation
Simultaneously, it computes the average closing price over the same lookback period to establish a baseline for the current price.
Probable Range Estimation
Using predefined mean percentage changes, the indicator calculates upper and lower boundaries that represent the probable range for price movements. These boundaries are adjusted for volatility, providing a dynamic perspective on where the price is in relation to typical fluctuations.
Signal Visualization
The lower and upper boundaries are plotted on the chart, color-coded in green and red, respectively. These plots help visualize zones where the price might be considered overextended or undervalued based on recent volatility.
The VAMS indicator allows for customization of the lookback period, enabling traders to adjust the sensitivity of the volatility measurement to match their trading style.
ملاحظات الأخبار
Added plot for the mean priceAdded input for the source of the mean price and volatility
ملاحظات الأخبار
Cleaned script codeنص برمجي مفتوح المصدر
بروح TradingView الحقيقية، قام مبتكر هذا النص البرمجي بجعله مفتوح المصدر، بحيث يمكن للمتداولين مراجعة وظائفه والتحقق منها. شكرا للمؤلف! بينما يمكنك استخدامه مجانًا، تذكر أن إعادة نشر الكود يخضع لقواعد الموقع الخاصة بنا.
🔍 Access Investing Strategies & Indicators
📊 whop.com/marktquant
🌐 marktquant.com
Nothing shared on this page constitutes financial advice. All information, tools, and analyses are provided solely for informational and educational purposes.
📊 whop.com/marktquant
🌐 marktquant.com
Nothing shared on this page constitutes financial advice. All information, tools, and analyses are provided solely for informational and educational purposes.
إخلاء المسؤولية
لا يُقصد بالمعلومات والمنشورات أن تكون، أو تشكل، أي نصيحة مالية أو استثمارية أو تجارية أو أنواع أخرى من النصائح أو التوصيات المقدمة أو المعتمدة من TradingView. اقرأ المزيد في شروط الاستخدام.
نص برمجي مفتوح المصدر
بروح TradingView الحقيقية، قام مبتكر هذا النص البرمجي بجعله مفتوح المصدر، بحيث يمكن للمتداولين مراجعة وظائفه والتحقق منها. شكرا للمؤلف! بينما يمكنك استخدامه مجانًا، تذكر أن إعادة نشر الكود يخضع لقواعد الموقع الخاصة بنا.
🔍 Access Investing Strategies & Indicators
📊 whop.com/marktquant
🌐 marktquant.com
Nothing shared on this page constitutes financial advice. All information, tools, and analyses are provided solely for informational and educational purposes.
📊 whop.com/marktquant
🌐 marktquant.com
Nothing shared on this page constitutes financial advice. All information, tools, and analyses are provided solely for informational and educational purposes.
إخلاء المسؤولية
لا يُقصد بالمعلومات والمنشورات أن تكون، أو تشكل، أي نصيحة مالية أو استثمارية أو تجارية أو أنواع أخرى من النصائح أو التوصيات المقدمة أو المعتمدة من TradingView. اقرأ المزيد في شروط الاستخدام.