OPEN-SOURCE SCRIPT
Treasury Yield Spread 10y-2y [TXMC]
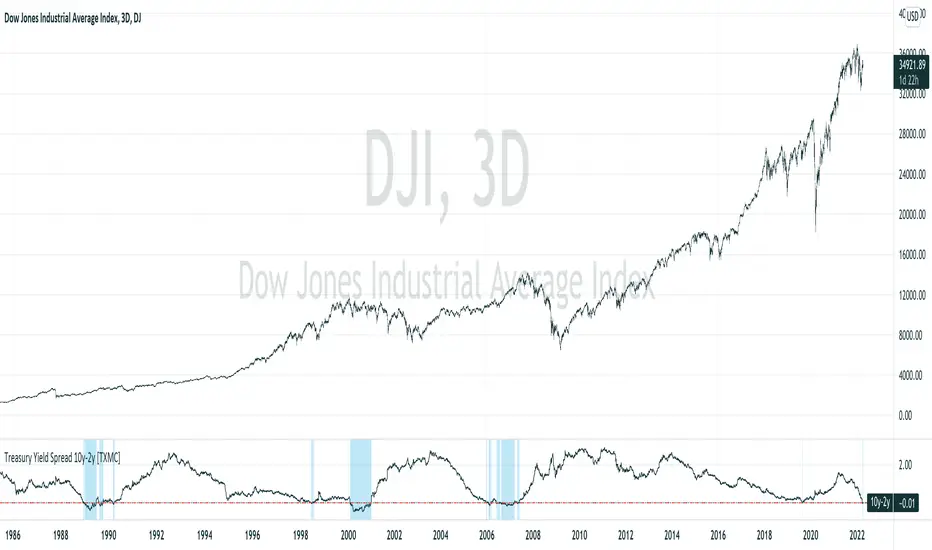
A simple indicator to show inversions of the US Treasury yield curve, specifically between the 2yr and 10yr yields.
A colored band prints when the 2yr treasury yield surpasses the 10yr, indicating an inversion of the yield curve.
This indicator is for educational purposes only.
A colored band prints when the 2yr treasury yield surpasses the 10yr, indicating an inversion of the yield curve.
This indicator is for educational purposes only.
نص برمجي مفتوح المصدر
بروح TradingView الحقيقية، قام مبتكر هذا النص البرمجي بجعله مفتوح المصدر، بحيث يمكن للمتداولين مراجعة وظائفه والتحقق منها. شكرا للمؤلف! بينما يمكنك استخدامه مجانًا، تذكر أن إعادة نشر الكود يخضع لقواعد الموقع الخاصة بنا.
إخلاء المسؤولية
The information and publications are not meant to be, and do not constitute, financial, investment, trading, or other types of advice or recommendations supplied or endorsed by TradingView. Read more in the Terms of Use.