MTPI TOTAL / BTC | JeffreyTimmermans
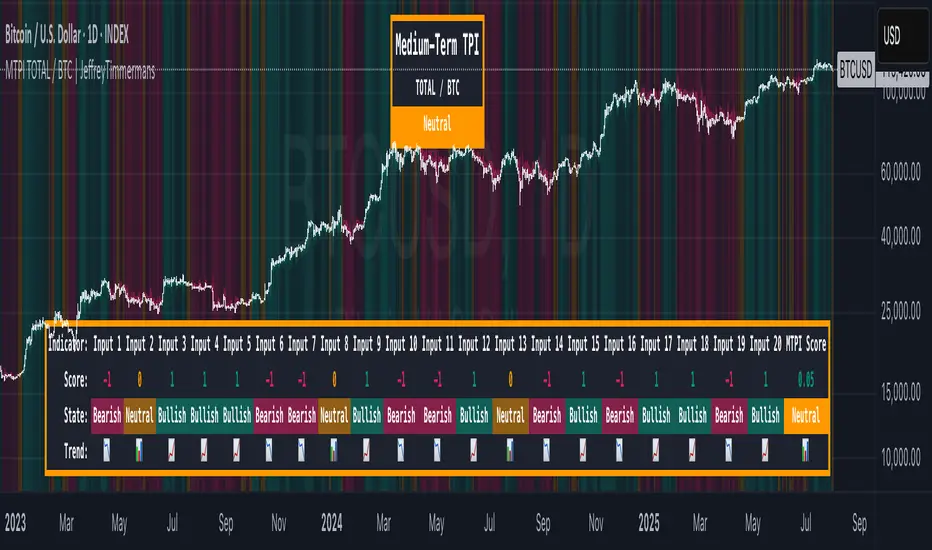
The "Medium-Term Probability Indicator (MTPI)" is a multi-factor model designed to evaluate the medium-term state of a market. By aggregating signals from 20 underlying inputs, it generates a composite score that classifies the market as Bullish, Bearish, or Neutral. This helps traders understand the prevailing market regime and adapt strategies accordingly.
Key Features
- Multi-Input Scoring: Combines up to 20 individual inputs (indicators, conditions, or models) into a single probability-based score.
- Composite Market State: Translates raw input signals into three states: Bullish, Bearish, or Neutral.
- Dynamic Background Coloring: Uses color-coded background shading to visually separate bullish, bearish, and neutral phases.
- MTPI Score: Calculates a final numeric score (ranging from -1 to +1) to quantify the market’s directional bias.
- Dashboard Display: Shows all input signals, their individual states, and the aggregated MTPI score at a glance.
- Medium-Term Focus: Helps identify prevailing conditions that last from several weeks to several months.
Inputs & Settings
MTPI Settings:
- Input Signals (1 to 20): Default: Predefined conditions. Each input evaluates the market from a unique perspective (trend, momentum, volatility, etc.).
- Composite Score Calculation: Default weighting is equal across all inputs.
Color Settings:
- Bullish: Bright green background
- Neutral: Gray/orange background
- Bearish: Bright red background
These colors can be customized as desired.
Calculation Process
Signal Aggregation:
Each input generates a state:
- 1 to 0.1 = Bullish
- 0.1 to -0.1 = Neutral
- -0.1 to -1 = Bearish
Scoring:
The MTPI aggregates these values and calculates an average score.
Classification:
- Bullish: Score > 0
- Bearish: Score < 0
- Neutral: Score ≈ 0
Visualization:
- Background Coloring: Highlights the dominant phase on the chart.
- Dashboard: Displays individual input states, the total MTPI score, and the resulting classification.
How to Use the MTPI
Identifying Market Regimes:
- Bullish: Majority of inputs align positively. Favor long positions or trend-following strategies.
- Bearish: Majority of inputs align negatively. Favor short positions or defensive strategies.
- Neutral: Mixed signals. Caution or range-bound strategies may be preferable.
Transition Detection:
- Changes in background color or the MTPI dashboard (score flipping from positive to negative, or vice versa) indicate potential regime shifts.
Dynamic Dashboard:
- Score: Displays the net sum of all input signals (normalized).
- State: Provides the classification (Bullish, Bearish, Neutral).
- Trend: Visual cues for each input showing the current contribution to the MTPI.
Conclusion
The Medium-Term Probability Indicator (MTPI) consolidates multiple signals into a single, intuitive visualization that helps traders quickly assess the medium-term market environment. Its combination of a multi-input dashboard, composite scoring, and background coloring makes it a powerful decision-support tool.
This script is developed by Jeffrey Timmermans and is designed to complement other analysis methods.
نص برمجي للمستخدمين المدعوين فقط
يمكن فقط للمستخدمين الذين تمت الموافقة عليهم من قبل المؤلف الوصول إلى هذا البرنامج النصي. ستحتاج إلى طلب الإذن والحصول عليه لاستخدامه. يتم منح هذا عادةً بعد الدفع. لمزيد من التفاصيل، اتبع تعليمات المؤلف أدناه أو اتصل ب JeffreyTimmermans مباشرة.
لا توصي TradingView بالدفع مقابل برنامج نصي أو استخدامه إلا إذا كنت تثق تمامًا في مؤلفه وتفهم كيفية عمله. يمكنك أيضًا العثور على بدائل مجانية ومفتوحة المصدر في نصوص مجتمعنا.
تعليمات المؤلف
إخلاء المسؤولية
نص برمجي للمستخدمين المدعوين فقط
يمكن فقط للمستخدمين الذين تمت الموافقة عليهم من قبل المؤلف الوصول إلى هذا البرنامج النصي. ستحتاج إلى طلب الإذن والحصول عليه لاستخدامه. يتم منح هذا عادةً بعد الدفع. لمزيد من التفاصيل، اتبع تعليمات المؤلف أدناه أو اتصل ب JeffreyTimmermans مباشرة.
لا توصي TradingView بالدفع مقابل برنامج نصي أو استخدامه إلا إذا كنت تثق تمامًا في مؤلفه وتفهم كيفية عمله. يمكنك أيضًا العثور على بدائل مجانية ومفتوحة المصدر في نصوص مجتمعنا.