Day of Month - Volatility Report
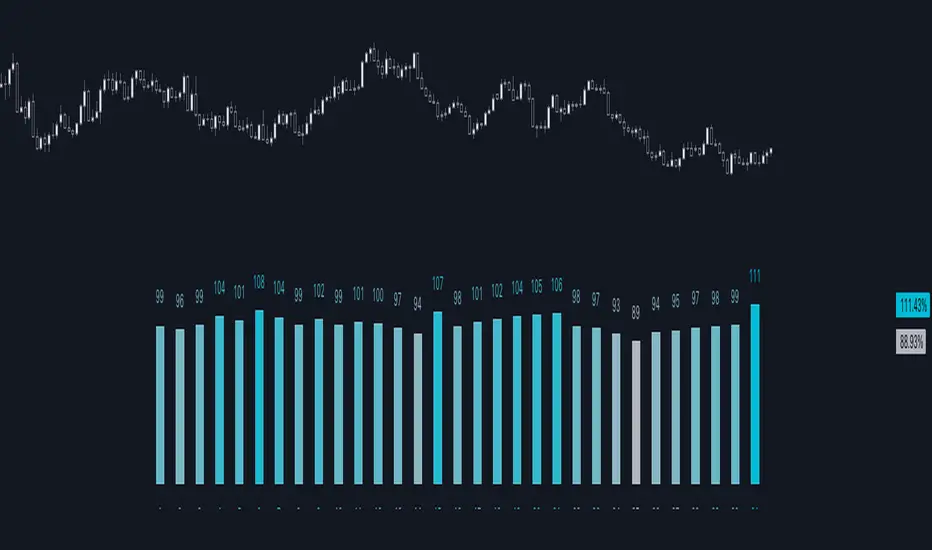
The indicator analyses the volatility and reports the statistics by the days of the month.
█ CONCEPTS
The markets move every day. But how does a market move during a month?
Here are some ideas to explore:
- Does the volatility kick in with the start of a new month?
- Do the markets slow down at the end of the month?
- Which period of the month is the most volatile?
- How does this relate to your best and worst trades?
- When should you take a break?
DAX
EURGBP
Binance Coin
█ FEATURES
Comparison modes
Compare how each day moves relative to the monthly volatility or the average daily volatility.
Configurable outputs
Output the report statistics as mean or median.
Range filter
Select the period to report from.
█ HOW TO USE
Plot the indicator and visit the 1D, 24H, or 1440 minutes timeframe.
█ NOTES
Gaps
The indicator includes the volatility from gaps.
Trading session
The indicator analyses each day from the daily chart, defined by the exchange trading session (see Symbol Info).
Extended trading session
The indicator can include the extended hours when activated on the chart, using the 24H or 1440 minutes timeframe.
Overnight session
The indicator supports overnight sessions (open and close on different calendar days). For example, EURUSD will report Monday’s volatility from Sunday open at 17:00 to Monday close at 17:00.
This is a PREMIUM indicator. In complement, you might find useful my free Time of Day - Volatility Report.
نص برمجي للمستخدمين المدعوين فقط
يمكن فقط للمستخدمين الذين تمت الموافقة عليهم من قبل المؤلف الوصول إلى هذا البرنامج النصي. ستحتاج إلى طلب الإذن والحصول عليه لاستخدامه. يتم منح هذا عادةً بعد الدفع. لمزيد من التفاصيل، اتبع تعليمات المؤلف أدناه أو اتصل ب sbtnc مباشرة.
لا توصي TradingView بالدفع مقابل برنامج نصي أو استخدامه إلا إذا كنت تثق تمامًا في مؤلفه وتفهم كيفية عمله. يمكنك أيضًا العثور على بدائل مجانية ومفتوحة المصدر في نصوص مجتمعنا.
تعليمات المؤلف
👨💻 Coding services: sbtnc.dev/hire-pine-script-developer
🔒 Premium indicators: sbtnc.gumroad.com
☕️ Tip: buymeacoffee.com/sbtnc
إخلاء المسؤولية
نص برمجي للمستخدمين المدعوين فقط
يمكن فقط للمستخدمين الذين تمت الموافقة عليهم من قبل المؤلف الوصول إلى هذا البرنامج النصي. ستحتاج إلى طلب الإذن والحصول عليه لاستخدامه. يتم منح هذا عادةً بعد الدفع. لمزيد من التفاصيل، اتبع تعليمات المؤلف أدناه أو اتصل ب sbtnc مباشرة.
لا توصي TradingView بالدفع مقابل برنامج نصي أو استخدامه إلا إذا كنت تثق تمامًا في مؤلفه وتفهم كيفية عمله. يمكنك أيضًا العثور على بدائل مجانية ومفتوحة المصدر في نصوص مجتمعنا.
تعليمات المؤلف
👨💻 Coding services: sbtnc.dev/hire-pine-script-developer
🔒 Premium indicators: sbtnc.gumroad.com
☕️ Tip: buymeacoffee.com/sbtnc