OPEN-SOURCE SCRIPT
تم تحديثه PE Band

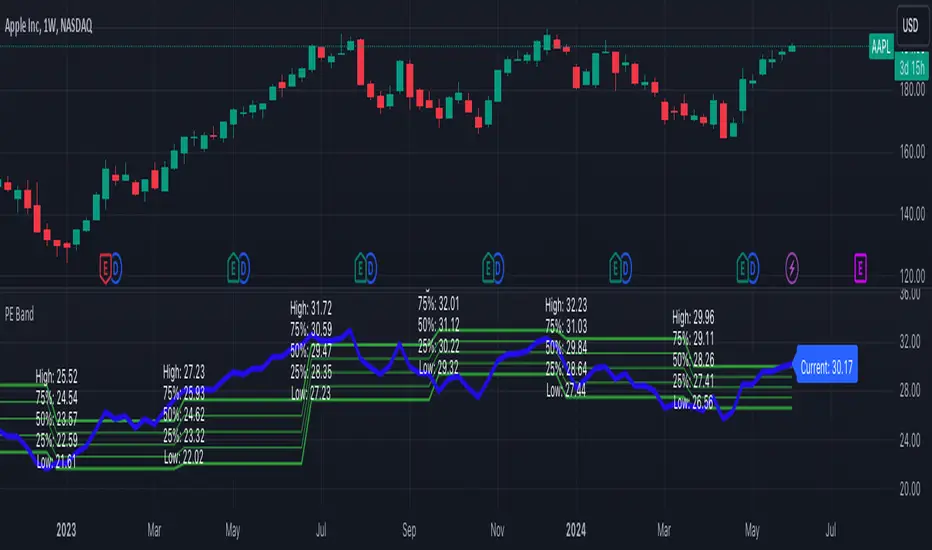
The PE Band shows the highest and lowest P/E in the previous period with TTM EPS. If the current P/E is lower than the minimum P/E, it is considered cheap. In other words, higher than the maximum P/E is considered expensive.
PE Band consists of 2 lines.
- Firstly, the historical P/E value in "green" (if TTM EPS is positive) or "red" (if TTM EPS is negative) states will change according to the latest high or low price of TTM EPS, such as: :
After the second quarter of 2023 (end of June), how do prices from 1 July – 30 September reflect net profits? The program will get the highest and lowest prices during that time.
After the 3rd quarter of 2023 (end of September), how do prices from 1 Oct. - 31 Dec. reflect net profits? The program will get the highest and lowest prices during that time.
- Second, the blue line is the closing price divided by TTM EPS, which shows the current P/E.
ملاحظات الأخبار
1. Change from "EARNINGS_PER_SHARE" to "EARNINGS_PER_SHARE_DILUTED"2. Add more lines of 75% P/E and 25% P/E
ملاحظات الأخبار
to solve Error on bar 5000 as comment - Add attribute "calc_bars_count = 5000" in indicator
نص برمجي مفتوح المصدر
بروح TradingView الحقيقية، قام مبتكر هذا النص البرمجي بجعله مفتوح المصدر، بحيث يمكن للمتداولين مراجعة وظائفه والتحقق منها. شكرا للمؤلف! بينما يمكنك استخدامه مجانًا، تذكر أن إعادة نشر الكود يخضع لقواعد الموقع الخاصة بنا.
إخلاء المسؤولية
لا يُقصد بالمعلومات والمنشورات أن تكون، أو تشكل، أي نصيحة مالية أو استثمارية أو تجارية أو أنواع أخرى من النصائح أو التوصيات المقدمة أو المعتمدة من TradingView. اقرأ المزيد في شروط الاستخدام.