PROTECTED SOURCE SCRIPT
تم تحديثه 4-EMA Trend

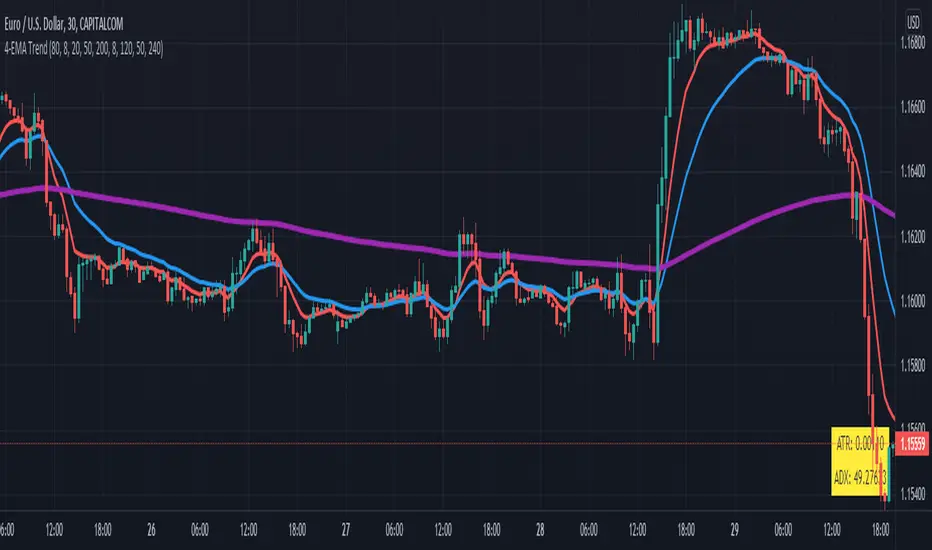
This indicator can be used to visualize when price is above or below special exponential moving averages (8, 21, 50 and 200) that are also displayed on the chart. A green or red background is plotted then, that can be followed as a trend. You can define the amount of risk (e.g. in $) and the number of previous bars that will be used to calculate the stop loss. For the stop loss a label is shown (long or short) that displays the quantity to buy or sell for your defined risk. It is recommend to use the indicator in combination with my Stochastic & RSI (see chart) to enter trades long or short when stochastic is overbought or oversold and RSI above or below 50.
 US100
US100
ملاحظات الأخبار
Update trend indication: ema8 has to be above / below slower emaملاحظات الأخبار
EMA description and length adjustedملاحظات الأخبار
Show stop loss buy or sell depending price above or below slowest EMAملاحظات الأخبار
SMA 40 added as special pullback indicatorملاحظات الأخبار
Added alerts for long or short trend changeملاحظات الأخبار
Add MTF support for slow EMAsملاحظات الأخبار
SMA replaced by EMA for trend detectionملاحظات الأخبار
Length of EMAs can be setملاحظات الأخبار
MTF EMA not displayed by default, 20, 50, 200 ema default lengthملاحظات الأخبار
ATR Stop added as dots (bullish, bearish)ملاحظات الأخبار
Input option for ema fast and middle lengthملاحظات الأخبار
EMA Ribbon added with option to hide itملاحظات الأخبار
Alert when price is close to trend EMA (default 200 EMA)ملاحظات الأخبار
Performance improved, ema ribbon removedملاحظات الأخبار
TEMA for trend includedملاحظات الأخبار
TEMA with custom length, pine version 5ملاحظات الأخبار
Refactoring and 4th ema addedملاحظات الأخبار
ATR stoploss multiplier addedملاحظات الأخبار
Added real price display for Heikin Ashi chart typeملاحظات الأخبار
Labels for engulfing candles addedملاحظات الأخبار
Engulfing pattern bug fixedملاحظات الأخبار
Barcolor for engulfing addedملاحظات الأخبار
Engulging candles added and atr to 10ملاحظات الأخبار
Volatility Stop Length addedملاحظات الأخبار
Inside bar added as candlestick patternملاحظات الأخبار
Inside bar without colorنص برمجي محمي
تم نشر هذا النص البرمجي كمصدر مغلق. ومع ذلك، يمكنك استخدامه بحرية ودون أي قيود - تعرف على المزيد هنا.
Access our indicators from: indivisionx.com
إخلاء المسؤولية
لا يُقصد بالمعلومات والمنشورات أن تكون، أو تشكل، أي نصيحة مالية أو استثمارية أو تجارية أو أنواع أخرى من النصائح أو التوصيات المقدمة أو المعتمدة من TradingView. اقرأ المزيد في شروط الاستخدام.
نص برمجي محمي
تم نشر هذا النص البرمجي كمصدر مغلق. ومع ذلك، يمكنك استخدامه بحرية ودون أي قيود - تعرف على المزيد هنا.
Access our indicators from: indivisionx.com
إخلاء المسؤولية
لا يُقصد بالمعلومات والمنشورات أن تكون، أو تشكل، أي نصيحة مالية أو استثمارية أو تجارية أو أنواع أخرى من النصائح أو التوصيات المقدمة أو المعتمدة من TradingView. اقرأ المزيد في شروط الاستخدام.