OPEN-SOURCE SCRIPT
تم تحديثه ORB + Premarket High/Low
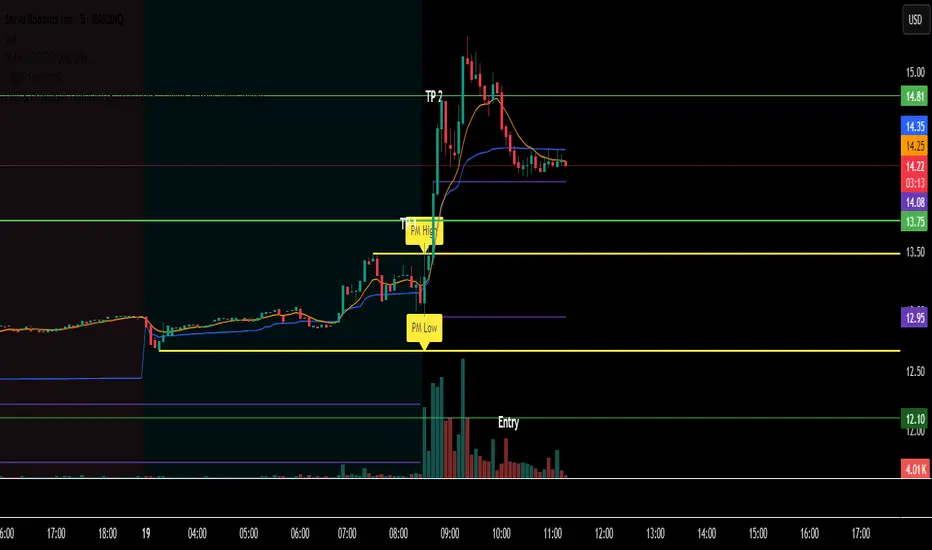
indicator that show opening range break plus premarket highs and lows
ملاحظات الأخبار
Indicator DescriptionThis indicator is a key part of a trading strategy focused on breakouts and breakdowns. It automatically marks two important price levels:
Premarket High and Low: The indicator identifies the highest and lowest prices reached during the premarket session (4:00 AM to 9:30 AM EST). It then draws these levels as horizontal lines that extend through the rest of the trading day.
Morning Open: It also highlights the first 15 minutes of the regular market open, which is what you use as your "Opening Range Breakout" (ORB) zone. Make sure to change this in settings as 9:30 to 9:45 EST
By clearly plotting these premarket and opening range levels on your chart, this tool helps you visualize key support and resistance zones, which is crucial for trading breakout and breakdown strategies.
نص برمجي مفتوح المصدر
بروح TradingView الحقيقية، قام مبتكر هذا النص البرمجي بجعله مفتوح المصدر، بحيث يمكن للمتداولين مراجعة وظائفه والتحقق منها. شكرا للمؤلف! بينما يمكنك استخدامه مجانًا، تذكر أن إعادة نشر الكود يخضع لقواعد الموقع الخاصة بنا.
إخلاء المسؤولية
لا يُقصد بالمعلومات والمنشورات أن تكون، أو تشكل، أي نصيحة مالية أو استثمارية أو تجارية أو أنواع أخرى من النصائح أو التوصيات المقدمة أو المعتمدة من TradingView. اقرأ المزيد في شروط الاستخدام.