OPEN-SOURCE SCRIPT
Inflation-Adjusted Price Indicator
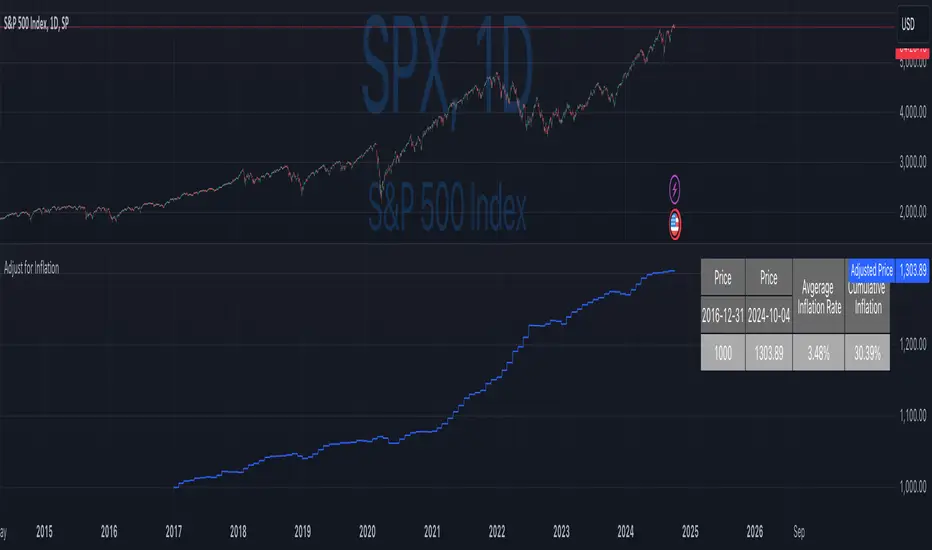
This indicator allows traders to adjust historical prices for inflation using customizable CPI data. The script computes the adjusted price by selecting a reference date, the original price, and the CPI source (US CPI or custom input) and plots it as a line on the chart. Additionally, a table summarizes the adjusted price values and average and total inflation rates.
While the indicator serves as a standalone tool to understand inflation's impact on prices, it is a supportive element in more advanced trading strategies requiring accurate analysis of inflation-adjusted data.
Disclaimer
Please remember that past performance may not be indicative of future results.
Due to various factors, including changing market conditions, the strategy may no longer perform as well as in historical backtesting.
This post and the script don’t provide any financial advice.
نص برمجي مفتوح المصدر
بروح TradingView الحقيقية، قام مبتكر هذا النص البرمجي بجعله مفتوح المصدر، بحيث يمكن للمتداولين مراجعة وظائفه والتحقق منها. شكرا للمؤلف! بينما يمكنك استخدامه مجانًا، تذكر أن إعادة نشر الكود يخضع لقواعد الموقع الخاصة بنا.
🎓 Pine Script 6 Course: qntly.com/ps6
💼 Hire Us: qntly.com/pine
📰 qntly.com/news
𝕏: qntly.com/x
📩 qntly.com/tel
💼 Hire Us: qntly.com/pine
📰 qntly.com/news
𝕏: qntly.com/x
📩 qntly.com/tel
إخلاء المسؤولية
لا يُقصد بالمعلومات والمنشورات أن تكون، أو تشكل، أي نصيحة مالية أو استثمارية أو تجارية أو أنواع أخرى من النصائح أو التوصيات المقدمة أو المعتمدة من TradingView. اقرأ المزيد في شروط الاستخدام.