OPEN-SOURCE SCRIPT
Volatility Switch Indicator [LazyBear]
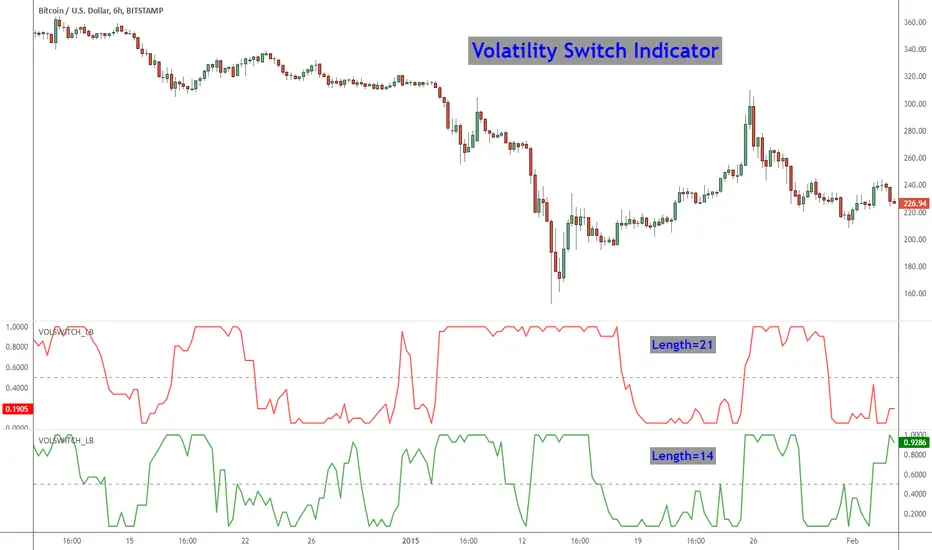
The Volatility Switch (VOLSWITCH) indicator, by Ron McEwan, estimates current volatility in respect to historical data, thus indicating whether the market is trending or in mean reversion mode. Range is normalized to 0 - 1.
When Volatility Switch rises above the 0.5 level, volatility in the market is increasing, thus the price action can be expected to become choppier with abrupt moves. When the indicator falls below the 0.5 level from recent high readings, volatility decreases, which may be considered a sign of trend formation.
Trading strategy as suggested by Ron McEwan is:
- If VOLSWITCH is less than 0.5, volatility decreases, which may be considered a sign of trend formation
- If VOLSWITCH is greater than 0.5, market is in high volatility mode. Can be choppy. Use RSI to look for OB/OS levels.
I have implemented support for 2 lengths (14 and 21) Note that, Pine doesn't support loops. Once it is introduced, I will publish an updated version.
Building a strategy out of this is straightforward (refer to my strategy explanation above), I strongly encourage new Pinescript coders to try to a plotarrow() based overlay indicator to get more familiar with Pine.
More info:
---------
The Volatility (Regime) Switch Indicator [S&C Feb 2013]: traders.com/Documentation/FEEDbk_docs/2013/02/McEwan.html
Complete list of my indicators:
-------------------------------------
docs.google.com/document/d/15AGCufJZ8CIUvwFJ9W-IKns88gkWOKBCvByMEvm5MLo/edit?usp=sharing
نص برمجي مفتوح المصدر
بروح TradingView الحقيقية، قام مبتكر هذا النص البرمجي بجعله مفتوح المصدر، بحيث يمكن للمتداولين مراجعة وظائفه والتحقق منها. شكرا للمؤلف! بينما يمكنك استخدامه مجانًا، تذكر أن إعادة نشر الكود يخضع لقواعد الموقع الخاصة بنا.
List of my free indicators: bit.ly/1LQaPK8
List of my indicators at Appstore: blog.tradingview.com/?p=970
List of my indicators at Appstore: blog.tradingview.com/?p=970
منشورات ذات صلة
إخلاء المسؤولية
لا يُقصد بالمعلومات والمنشورات أن تكون، أو تشكل، أي نصيحة مالية أو استثمارية أو تجارية أو أنواع أخرى من النصائح أو التوصيات المقدمة أو المعتمدة من TradingView. اقرأ المزيد في شروط الاستخدام.