PROTECTED SOURCE SCRIPT
RSI Team Synergy | JeffreyTimmermans

RSI Team Synergy
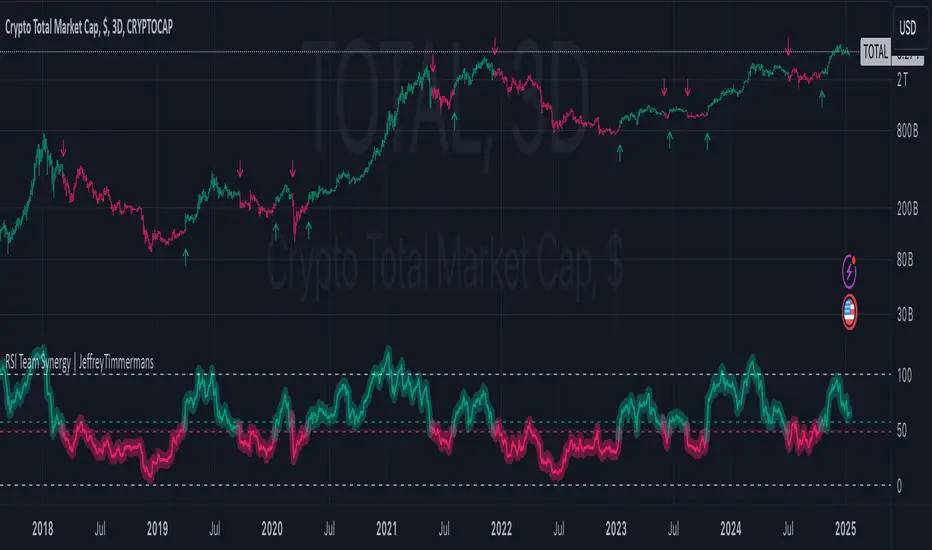
The "RSI Team Synergy" indicator is an advanced and highly customizable tool that integrates a Double RSI (DRSI) approach for comprehensive trend and momentum analysis. It utilizes two layers of RSI calculations, along with optional smoothing and various moving average types, to enhance signal accuracy. The dynamic visuals and alerts make this indicator a valuable resource for traders aiming to optimize their strategies.
Key Features
Double RSI (DRSI) Calculation
Smoothing and Advanced Moving Averages
Threshold and Signal System
Dynamic Visualization
Bar Color Integration
Alerts
Signal Arrows
Improvements
Use Cases
The RSI Team Synergy indicator combines precision, flexibility, and intuitive design, making it an essential tool for traders at all levels. With its innovative Double RSI approach and advanced customization options, it provides actionable insights for mastering market trends.
This script is inspired by "Clokivez". However, it is more advanced and includes additional features and options.
-Jeffrey
The "RSI Team Synergy" indicator is an advanced and highly customizable tool that integrates a Double RSI (DRSI) approach for comprehensive trend and momentum analysis. It utilizes two layers of RSI calculations, along with optional smoothing and various moving average types, to enhance signal accuracy. The dynamic visuals and alerts make this indicator a valuable resource for traders aiming to optimize their strategies.
Key Features
Double RSI (DRSI) Calculation
- First RSI (Primary Layer): Captures the core price momentum using a configurable period.
- Second RSI (DRSI Layer): Applies a second RSI calculation to the smoothed first RSI, refining signals and amplifying trend accuracy.
- Double RSI Formula: Combines the smoothed RSI layers into a single robust indicator that adapts to market conditions.
Smoothing and Advanced Moving Averages
- Optional Smoothing: Enables users to reduce noise by applying smoothing to both RSI layers.
- Advanced MA Options: Supports multiple MA types, including SMA, EMA, WMA, RMA, DEMA, TEMA, VWMA, ZLEMA, and HMA. These can be applied to tailor the indicator to specific trading conditions.
- Separate Configurations: Independent smoothing lengths and types for each RSI layer provide unparalleled customization.
Threshold and Signal System
- Long Threshold: Highlights bullish conditions when the Double RSI exceeds the threshold.
- Short Threshold: Signals bearish conditions when the Double RSI falls below the threshold.
- Directional State: Tracks the overall direction using a state-based signal system (bullish, bearish, or neutral).
Dynamic Visualization
- Oscillator Color Coding: Green shades for bullish momentum. Red shades for bearish momentum. Dynamic gradients for smoother transitions.
- Glow Effect: Optional glowing lines enhance the visual clarity of the oscillator.
- Threshold Lines: Configurable dashed horizontal lines to mark critical levels for easy reference.
Bar Color Integration
- Bar Coloring: Matches bar colors to the oscillator's direction for cohesive visualization.
- Advanced Control: Toggle bar coloring on/off without affecting other plots.
Alerts
- Bullish Signal Alert: Triggers when the Double RSI crosses above the long threshold.
- Bearish Signal Alert: Triggers when the Double RSI crosses below the short threshold.
- Custom Messages: Alerts are equipped with descriptive messages for actionable insights.
Signal Arrows
- Bullish Arrow (↑): Marks upward trends directly on the chart.
- Bearish Arrow (↓): Highlights downward trends, ensuring traders never miss an opportunity.
Improvements
- Customizable Thresholds: Adjustable long and short thresholds allow traders to fine-tune sensitivity.
- Enhanced Smoothing Control: Separate smoothing options for each RSI layer provide flexibility in noise reduction.
- Multiple MA Types: Extensive support for advanced moving averages to suit diverse trading preferences.
- Color-Coded Oscillator: Improves trend visibility with gradient-based coloring and optional glow effects.
- Signal Detection: Clear and intuitive arrows directly on the chart for quick signal interpretation.
- Alerts and Notifications: Comprehensive alert conditions keep traders informed in real-time.
Use Cases
- Momentum Analysis: Identify sustained bullish or bearish trends using the Double RSI calculation.
- Noise Reduction: Utilize smoothing and advanced MA options to remove market noise.
- Reversal Detection: Spot potential trend reversals with threshold-based signals.
- Customizable Strategies: Tailor the indicator for scalping, swing trading, or long-term analysis.
The RSI Team Synergy indicator combines precision, flexibility, and intuitive design, making it an essential tool for traders at all levels. With its innovative Double RSI approach and advanced customization options, it provides actionable insights for mastering market trends.
This script is inspired by "Clokivez". However, it is more advanced and includes additional features and options.
-Jeffrey
نص برمجي محمي
تم نشر هذا النص البرمجي كمصدر مغلق. ومع ذلك، يمكنك استخدامه بحرية ودون أي قيود - تعرف على المزيد هنا.
@JeffreyTimmermans
إخلاء المسؤولية
لا يُقصد بالمعلومات والمنشورات أن تكون، أو تشكل، أي نصيحة مالية أو استثمارية أو تجارية أو أنواع أخرى من النصائح أو التوصيات المقدمة أو المعتمدة من TradingView. اقرأ المزيد في شروط الاستخدام.