OPEN-SOURCE SCRIPT
Percentile Calculation @xcod33

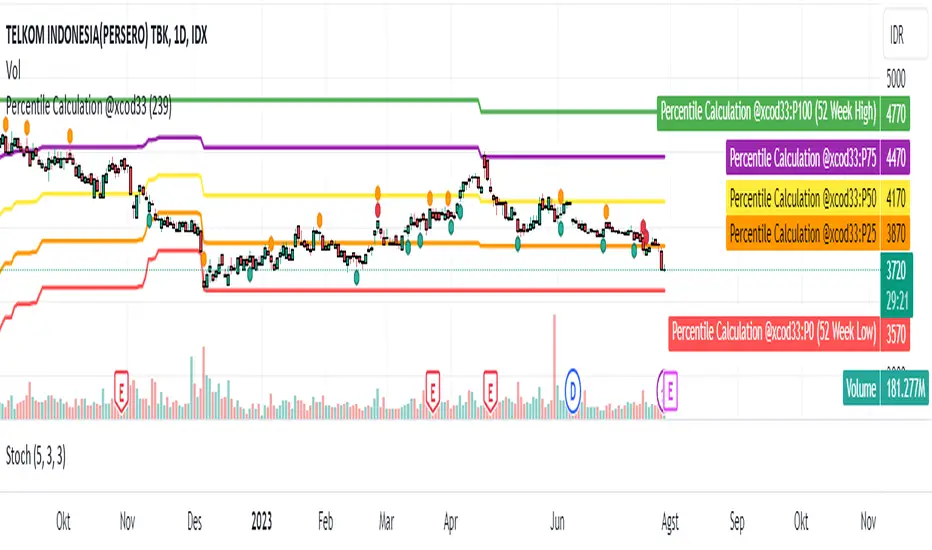
This script calculates the current price percentile based on the highest and lowest price range in the last 52 weeks.
How to Use:
This script will provide the current price percentile relative to the 52-week price range on your chart. You can use it as an indicator to help identify where the current price stands relative to the historical price range in that period.
Targeted Market:
This script can be applied to various financial markets, including stocks, forex, indices, commodities, and others. It is not limited to a specific market and can be used across various trading instruments.
Market Conditions:
Here are some market conditions where this script can be useful:
1. Identifying Price Extremes: By looking at the current percentile, you can see if the price is near the highest or lowest extremes in the last 52 weeks. If the percentile is close to 0%, it means the price is near the lowest, while a percentile close to 100% indicates the price is near the highest.
Finding Consolidation Patterns: You can identify whether the price is within a certain range by looking at the percentile. If the percentile is around 50%, it indicates a relatively consistent price range.
2. Identifying Breakouts and Pullbacks: When the price is outside the historical range and the percentile approaches 100%, it indicates a breakout. When the price retraces back to the range and the percentile approaches 50%, it indicates a pullback.
3. However, keep in mind that this indicator only provides an additional perspective on the price relative to the 52-week range. It is not recommended to use this indicator as the sole basis for trading decisions. Always use further analysis and other indicators to confirm your trading signals.
Credit :
- M Rico Aditya Prayoga | Author
- Tri Okta Setiawan Marblo | Maker of formulas and ideas
نص برمجي مفتوح المصدر
بروح TradingView الحقيقية، قام مبتكر هذا النص البرمجي بجعله مفتوح المصدر، بحيث يمكن للمتداولين مراجعة وظائفه والتحقق منها. شكرا للمؤلف! بينما يمكنك استخدامه مجانًا، تذكر أن إعادة نشر الكود يخضع لقواعد الموقع الخاصة بنا.
إخلاء المسؤولية
لا يُقصد بالمعلومات والمنشورات أن تكون، أو تشكل، أي نصيحة مالية أو استثمارية أو تجارية أو أنواع أخرى من النصائح أو التوصيات المقدمة أو المعتمدة من TradingView. اقرأ المزيد في شروط الاستخدام.