PROTECTED SOURCE SCRIPT
تم تحديثه MTF FVG with Hit Counter HarmoniXTrade
Main Purpose of the Indicator:
This indicator is designed to automatically identify Fair Value Gaps (FVG) across three different timeframes simultaneously. The primary goal is to display these key zones on the chart and provide detailed information about price interaction with these levels, enabling traders to make more informed decisions.
Key Features:
Multi-Timeframe FVG Identification:
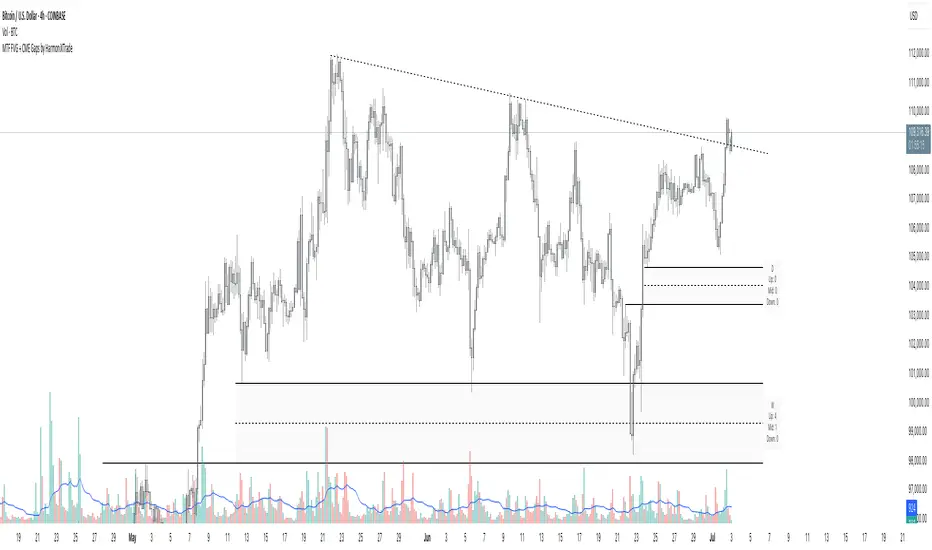
By default, the indicator identifies and displays FVGs on the Weekly (W), Daily (D), and 4-Hour (240) timeframes.
Users can customize these timeframes in the settings to fit their preferences.
Detailed Hit Counter:
This indicator goes beyond simply showing FVGs; it accurately counts the number of times the price has touched each of the three key FVG levels:
Up: The top line of the FVG
Mid: The midline (equilibrium) of the FVG
Down: The bottom line of the FVG
This information is displayed in a clear label next to each FVG zone, helping traders assess the strength and validity of each level.
Extensive Customization:
Appearance: You can change the colors for bullish and bearish FVGs for each timeframe individually, modify the style of the main and mid lines, and adjust the label size.
Detection Logic: Users can define the minimum size of an FVG for detection based on a percentage or point value.
Mitigation Logic: Two methods are provided for FVG invalidation:
Percentage Mitigation: The FVG is considered mitigated after the price has penetrated it by a specific percentage (e.g., 50%).
Full Fill: The FVG remains valid until the price has completely filled the gap and closed beyond it.
Extend Lines Capability:
To prevent chart clutter and get a better view of future price action, you can extend the FVG lines and labels to the right by a specified number of bars, creating distance from the current candle.
How to Use This Indicator:
Identifying Support and Resistance Zones: FVG areas can act as strong support and resistance levels.
Confirming Entry Points: A price touch and reaction to one of the FVG levels (especially the midline) can be used as a confirmation for entering a trade.
Assessing Level Strength: The number of hits on each level (Up, Mid, Down) indicates which price point within the zone has been more attractive to the market. For example, repeated reactions to the top line of a bearish FVG might suggest strong selling pressure at that level.
Your Feedback for Improvement:
You are invited to use this indicator and share any suggestions, ideas for improvement, or reports of potential issues. Your feedback will be valuable for implementation in future versions.
This indicator is designed to automatically identify Fair Value Gaps (FVG) across three different timeframes simultaneously. The primary goal is to display these key zones on the chart and provide detailed information about price interaction with these levels, enabling traders to make more informed decisions.
Key Features:
Multi-Timeframe FVG Identification:
By default, the indicator identifies and displays FVGs on the Weekly (W), Daily (D), and 4-Hour (240) timeframes.
Users can customize these timeframes in the settings to fit their preferences.
Detailed Hit Counter:
This indicator goes beyond simply showing FVGs; it accurately counts the number of times the price has touched each of the three key FVG levels:
Up: The top line of the FVG
Mid: The midline (equilibrium) of the FVG
Down: The bottom line of the FVG
This information is displayed in a clear label next to each FVG zone, helping traders assess the strength and validity of each level.
Extensive Customization:
Appearance: You can change the colors for bullish and bearish FVGs for each timeframe individually, modify the style of the main and mid lines, and adjust the label size.
Detection Logic: Users can define the minimum size of an FVG for detection based on a percentage or point value.
Mitigation Logic: Two methods are provided for FVG invalidation:
Percentage Mitigation: The FVG is considered mitigated after the price has penetrated it by a specific percentage (e.g., 50%).
Full Fill: The FVG remains valid until the price has completely filled the gap and closed beyond it.
Extend Lines Capability:
To prevent chart clutter and get a better view of future price action, you can extend the FVG lines and labels to the right by a specified number of bars, creating distance from the current candle.
How to Use This Indicator:
Identifying Support and Resistance Zones: FVG areas can act as strong support and resistance levels.
Confirming Entry Points: A price touch and reaction to one of the FVG levels (especially the midline) can be used as a confirmation for entering a trade.
Assessing Level Strength: The number of hits on each level (Up, Mid, Down) indicates which price point within the zone has been more attractive to the market. For example, repeated reactions to the top line of a bearish FVG might suggest strong selling pressure at that level.
Your Feedback for Improvement:
You are invited to use this indicator and share any suggestions, ideas for improvement, or reports of potential issues. Your feedback will be valuable for implementation in future versions.
ملاحظات الأخبار
Updated with MTF CME Gaps,Now you can see Gaps on your chart!!
ملاحظات الأخبار
Now, you can see liquidity on the chart, which can help you understand the FVG is important or not!!!ملاحظات الأخبار
Some bug's fix !!!ملاحظات الأخبار
Removed CME Gaps نص برمجي محمي
تم نشر هذا النص البرمجي كمصدر مغلق. ومع ذلك، يمكنك استخدامه بحرية ودون أي قيود - تعرف على المزيد هنا.
إخلاء المسؤولية
لا يُقصد بالمعلومات والمنشورات أن تكون، أو تشكل، أي نصيحة مالية أو استثمارية أو تجارية أو أنواع أخرى من النصائح أو التوصيات المقدمة أو المعتمدة من TradingView. اقرأ المزيد في شروط الاستخدام.
نص برمجي محمي
تم نشر هذا النص البرمجي كمصدر مغلق. ومع ذلك، يمكنك استخدامه بحرية ودون أي قيود - تعرف على المزيد هنا.
إخلاء المسؤولية
لا يُقصد بالمعلومات والمنشورات أن تكون، أو تشكل، أي نصيحة مالية أو استثمارية أو تجارية أو أنواع أخرى من النصائح أو التوصيات المقدمة أو المعتمدة من TradingView. اقرأ المزيد في شروط الاستخدام.