PROTECTED SOURCE SCRIPT
تم تحديثه [INVX] P/E band (overlay)
What is it?
Why P/E Bollinger Band?
Who should use it
How to use
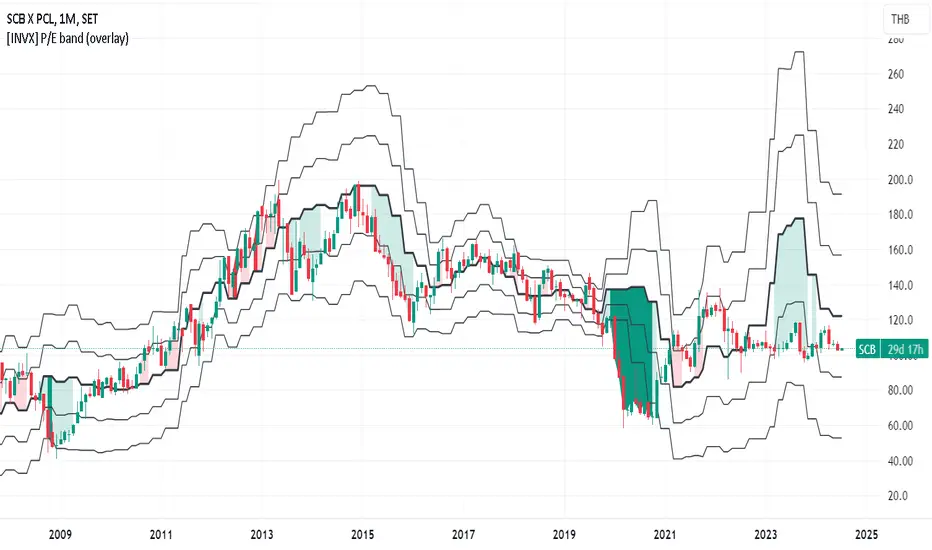
- The P/E Bollinger Band indicator is a hybrid tool combining fundamental analysis (P/E ratio) with technical analysis (Bollinger Bands).
- It uses Bollinger Bands around a company's P/E ratio to identify potentially overvalued or undervalued zones.
- The P/E ratio itself measures a stock's price relative to its earnings per share.
- The Bollinger Bands, based on standard deviations, create a dynamic upper and lower band around the average P/E ratio.
Why P/E Bollinger Band?
- Provides a visual representation of a company's relative valuation compared to its historical P/E range.
- Can help identify areas where the P/E ratio might be deviating significantly from its historical norm.
Who should use it
- Investors who combine technical and fundamental analysis for a more comprehensive stock evaluation.
- Value investors seeking to identify potentially undervalued companies.
How to use
- A P/E value that breaches the upper Bollinger Band suggests potential overvaluation, indicating the stock might be due for a price correction.
- Conversely, a P/E value that falls below the lower Bollinger Band might signal undervaluation, presenting a potential buying opportunity (considering the company's fundamentals remain sound).
ملاحظات الأخبار
- Use earnings.standardized (fully diluted EPS) instead of earnings.actual.
- Hide P/E bands when P/E is negative.
نص برمجي محمي
تم نشر هذا النص البرمجي كمصدر مغلق. However, you can use it freely and without any limitations – learn more here.
إخلاء المسؤولية
The information and publications are not meant to be, and do not constitute, financial, investment, trading, or other types of advice or recommendations supplied or endorsed by TradingView. Read more in the Terms of Use.