PROTECTED SOURCE SCRIPT
Disparity Offset [WizardTrendsInc]
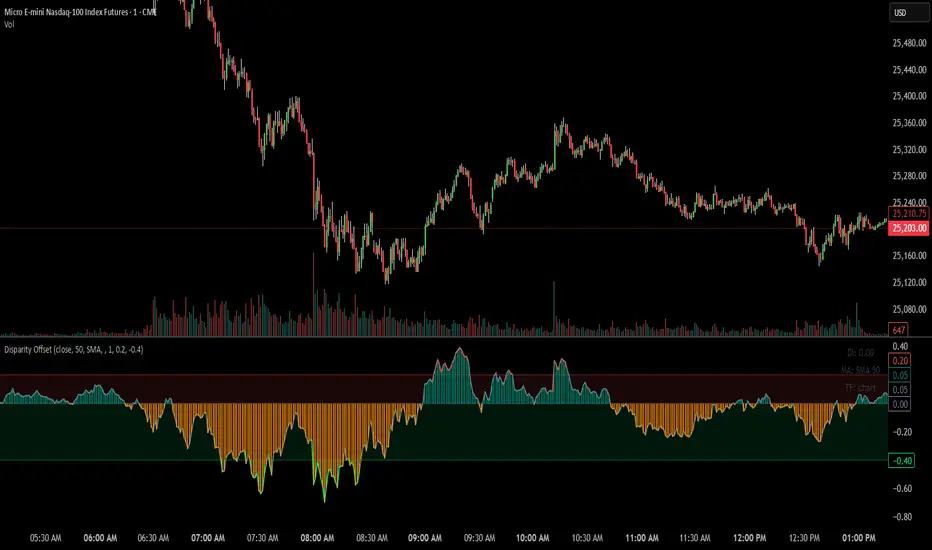
Disparity Offset
Description
Disparity Offset measures how far price is offset from a selected moving average, expressed as a percentage. It shows whether price is trading above or below its average and by how much, helping visualize price extension, balance, and deviation from the mean. The indicator oscillates around a zero line, where zero represents price being aligned with the moving average.
How to Use Disparity Offset
Zero Line (0%)
When the Disparity Offset is near zero, price is close to the moving average, suggesting equilibrium.
Positive Values
Values above zero indicate price is above the moving average. Larger positive readings show stronger upward offset from the average.
Negative Values
Values below zero indicate price is below the moving average. Larger negative readings show stronger downward offset
Upper & Lower Offset Zones
The configurable upper and lower percentage levels highlight when price is relatively far from the moving average. Movement back toward the zero line can be used to study mean-reversion behavior.
Visual Aids
Histogram bars show direction and intensity of the offset
Shaded zones emphasize overextended conditions
Optional markers display crossings of offset levels and the zero line for observation and learning
"Disclaimer: This indicator is intended for educational purposes only and does not constitute financial advice. Trading involves significant risk, and users should perform their own research and consult with a licensed financial advisor before making any trading decisions.
نص برمجي محمي
تم نشر هذا النص البرمجي كمصدر مغلق. ومع ذلك، يمكنك استخدامه بحرية ودون أي قيود - تعرف على المزيد هنا.
إخلاء المسؤولية
لا يُقصد بالمعلومات والمنشورات أن تكون، أو تشكل، أي نصيحة مالية أو استثمارية أو تجارية أو أنواع أخرى من النصائح أو التوصيات المقدمة أو المعتمدة من TradingView. اقرأ المزيد في شروط الاستخدام.