OPEN-SOURCE SCRIPT
تم تحديثه Periodic OHL
Here is another experience on working with 'time' variable :)
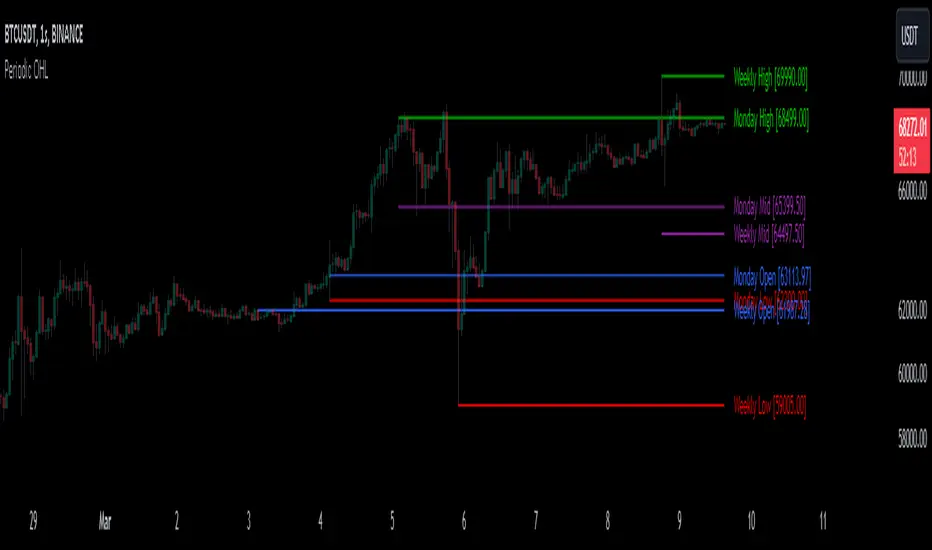
This script generates potential support and resistance levels based on daily, weekly, and monthly open, high, and low prices. In such indicators, security calls produce effective results. However, similar tasks can also be performed by built-in variables. This script serves as an example of how alternative methods can be constructed.
The originality of the indicator is based on its ability to visualise the current open, high and low prices from the bar at which they occur. You can also display levels simultaneously.
I hope it helps everyone...

DISCLAIMER
This is just an indicator, nothing more. It is provided for informational and educational purposes exclusively. The utilization of this script does not constitute professional or financial advice. The user solely bears the responsibility for risks associated with script usage. Do not forget to manage your risk. And trade as safely as possible. Best of luck!
This script generates potential support and resistance levels based on daily, weekly, and monthly open, high, and low prices. In such indicators, security calls produce effective results. However, similar tasks can also be performed by built-in variables. This script serves as an example of how alternative methods can be constructed.
The originality of the indicator is based on its ability to visualise the current open, high and low prices from the bar at which they occur. You can also display levels simultaneously.
I hope it helps everyone...
DISCLAIMER
This is just an indicator, nothing more. It is provided for informational and educational purposes exclusively. The utilization of this script does not constitute professional or financial advice. The user solely bears the responsibility for risks associated with script usage. Do not forget to manage your risk. And trade as safely as possible. Best of luck!
ملاحظات الأخبار
Some inconsistent results observed at high timeframes were fixed experimentally :)نص برمجي مفتوح المصدر
بروح TradingView الحقيقية، قام مبتكر هذا النص البرمجي بجعله مفتوح المصدر، بحيث يمكن للمتداولين مراجعة وظائفه والتحقق منها. شكرا للمؤلف! بينما يمكنك استخدامه مجانًا، تذكر أن إعادة نشر الكود يخضع لقواعد الموقع الخاصة بنا.
إخلاء المسؤولية
لا يُقصد بالمعلومات والمنشورات أن تكون، أو تشكل، أي نصيحة مالية أو استثمارية أو تجارية أو أنواع أخرى من النصائح أو التوصيات المقدمة أو المعتمدة من TradingView. اقرأ المزيد في شروط الاستخدام.
نص برمجي مفتوح المصدر
بروح TradingView الحقيقية، قام مبتكر هذا النص البرمجي بجعله مفتوح المصدر، بحيث يمكن للمتداولين مراجعة وظائفه والتحقق منها. شكرا للمؤلف! بينما يمكنك استخدامه مجانًا، تذكر أن إعادة نشر الكود يخضع لقواعد الموقع الخاصة بنا.
إخلاء المسؤولية
لا يُقصد بالمعلومات والمنشورات أن تكون، أو تشكل، أي نصيحة مالية أو استثمارية أو تجارية أو أنواع أخرى من النصائح أو التوصيات المقدمة أو المعتمدة من TradingView. اقرأ المزيد في شروط الاستخدام.