OPEN-SOURCE SCRIPT
USDT.D + USDT.C ALL TIMEFRAMES
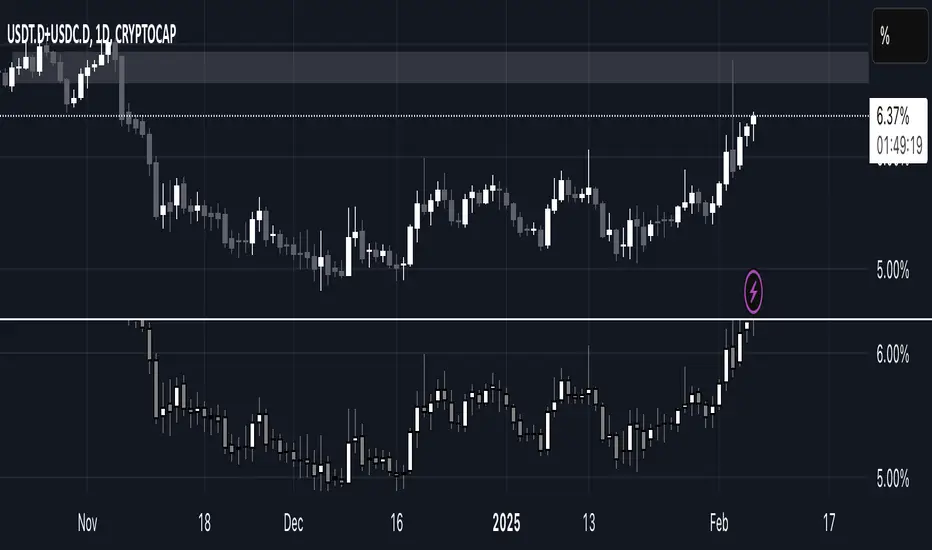
This indicator combines the dominance of USDT (USDT.D) and USDC (USDC.D) to track total stablecoin market share across all timeframes. It displays the combined dominance as candlesticks, providing a clearer view of market liquidity shifts and investor sentiment.
📌 How to Use:
Green candles indicate rising stablecoin dominance (potential risk-off sentiment).
Red candles indicate declining stablecoin dominance (potential risk-on sentiment).
Works on all timeframes, from intraday scalping to macro trend analysis.
This tool is essential for traders looking to analyze stablecoin liquidity flow, identify market turning points, and refine trading strategies based on stablecoin dominance behavior. 🚀
نص برمجي مفتوح المصدر
بروح TradingView الحقيقية، قام مبتكر هذا النص البرمجي بجعله مفتوح المصدر، بحيث يمكن للمتداولين مراجعة وظائفه والتحقق منها. شكرا للمؤلف! بينما يمكنك استخدامه مجانًا، تذكر أن إعادة نشر الكود يخضع لقواعد الموقع الخاصة بنا.
إخلاء المسؤولية
لا يُقصد بالمعلومات والمنشورات أن تكون، أو تشكل، أي نصيحة مالية أو استثمارية أو تجارية أو أنواع أخرى من النصائح أو التوصيات المقدمة أو المعتمدة من TradingView. اقرأ المزيد في شروط الاستخدام.