OPEN-SOURCE SCRIPT
تم تحديثه Frosted 12 EMA WIDTH
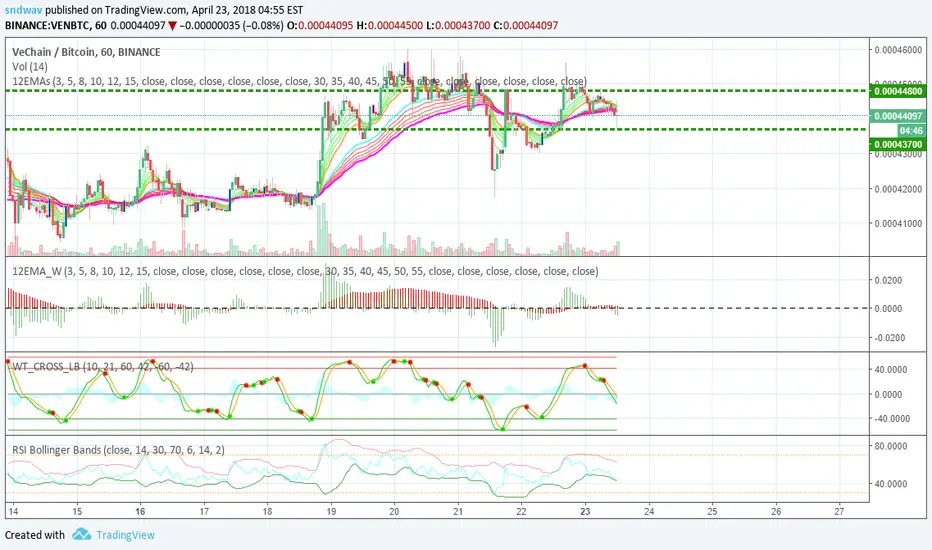
This is a complementary indicator for the 12 EMAs indicator (tradingview.com/script/2svpFULS-Frosted-12-EMAs/)
This width indicator shows the fanning width of each fan (shorter MAs and longer MAs).
To make things easier to see:
You can turn off one of the histograms to view just one of the widths (and add a 2nd instance of this indicator, turning off the other width).
This width indicator shows the fanning width of each fan (shorter MAs and longer MAs).
To make things easier to see:
You can turn off one of the histograms to view just one of the widths (and add a 2nd instance of this indicator, turning off the other width).
ملاحظات الأخبار
NEW ADDITIONS:- Added a Width Between line, which shows the width between the two EMA fans: Basically, when the line is at 0, then the slowest EMA of the Slow Fan and the fastest EMA of the Fast Fan are crossing each other. (It is possible to hide this line, or any of the histograms, in the configuration window).
- Added 6 (configurable) horizontal lines to help visualize things better.
Changes to defaults values:
- Changed the line thickness of the Slow Fan's histogram to help differentiate between histograms in overlapping areas.
Enjoy!
نص برمجي مفتوح المصدر
بروح TradingView الحقيقية، قام مبتكر هذا النص البرمجي بجعله مفتوح المصدر، بحيث يمكن للمتداولين مراجعة وظائفه والتحقق منها. شكرا للمؤلف! بينما يمكنك استخدامه مجانًا، تذكر أن إعادة نشر الكود يخضع لقواعد الموقع الخاصة بنا.
إخلاء المسؤولية
لا يُقصد بالمعلومات والمنشورات أن تكون، أو تشكل، أي نصيحة مالية أو استثمارية أو تجارية أو أنواع أخرى من النصائح أو التوصيات المقدمة أو المعتمدة من TradingView. اقرأ المزيد في شروط الاستخدام.