OPEN-SOURCE SCRIPT
VNIndex Over 6.5% Downside Drop Indicator with Table
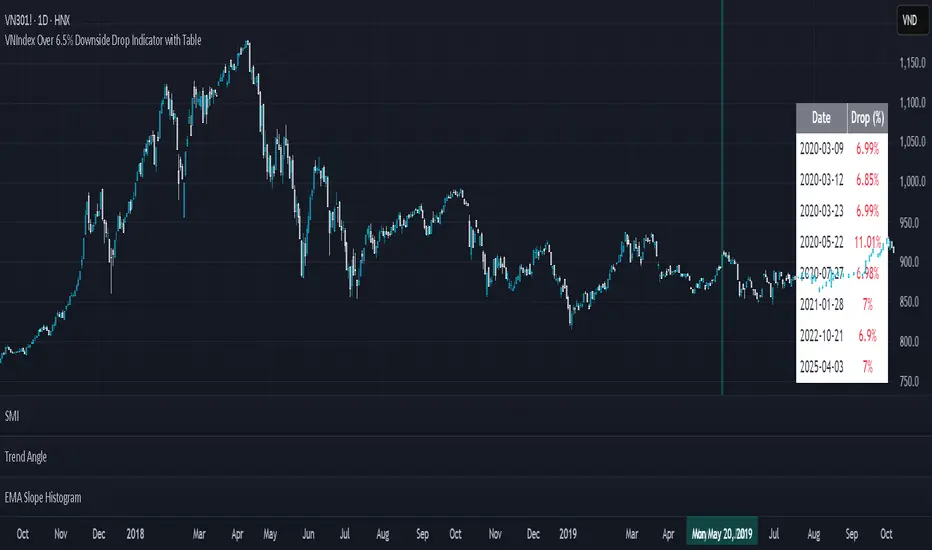
Overview: The VNIndex 6.5% Downside Drop Indicator is a powerful tool designed to help traders and investors identify significant market drops on the VNIndex (or any other asset) based on a 6.5% downside threshold. This Pine Script® indicator automatically detects when the price of an asset drops by more than 6.5% within a single day, and visually marks those events on the chart.
Key Features:
6.5% Downside Drop Detection: Automatically calculates the daily percentage drop and identifies when the price falls by more than 6.5%.
Table Display: Displays the dates and corresponding percentage drops of all identified instances in a convenient table at the bottom right of the chart.
Markers: Red down-pointing markers are plotted above bars where the price drop exceeds the 6.5% threshold, making it easy to spot critical drop events at a glance.
Easy-to-Read Table: The table lists the date and drop percentage, updating dynamically as new drops are detected. This allows for easy tracking of significant downside moves over time.
How to Use:
Install the Script: Add this indicator to your TradingView chart.
Monitor Price Drops: The indicator will automatically detect when the price drops by over 6.5% from the previous close and display a marker on the chart and the table in the bottom right corner.
View the Table: The table displays the date and the percentage drop of each detected event, making it easy to track past significant moves.
Alerts: You can set an alert for 6.5% drops to receive notifications in real-time.
Customization Options:
The drop percentage threshold (6.5%) can be adjusted in the script to fit other market conditions or assets.
The table can be resized or styled based on user preference for better visibility.
Why Use This Indicator? This indicator is perfect for traders looking to spot large, significant price movements quickly. Large downside drops can signal potential market reversals or trading opportunities, and this tool helps you track such events effortlessly. Whether you're monitoring the VNIndex or any other asset, this indicator provides crucial insights into volatile price action, helping you make more informed decisions.
Open Source License: This indicator is open source and free to use under the Mozilla Public License 2.0. You are welcome to modify, distribute, and contribute to the project.
Contributions: Feel free to contribute improvements, fixes, or new features by creating a pull request. Let’s collaborate to make this indicator even better for the community!
نص برمجي مفتوح المصدر
بروح TradingView الحقيقية، قام مبتكر هذا النص البرمجي بجعله مفتوح المصدر، بحيث يمكن للمتداولين مراجعة وظائفه والتحقق منها. شكرا للمؤلف! بينما يمكنك استخدامه مجانًا، تذكر أن إعادة نشر الكود يخضع لقواعد الموقع الخاصة بنا.
MikeJSaylor @ telegram
إخلاء المسؤولية
لا يُقصد بالمعلومات والمنشورات أن تكون، أو تشكل، أي نصيحة مالية أو استثمارية أو تجارية أو أنواع أخرى من النصائح أو التوصيات المقدمة أو المعتمدة من TradingView. اقرأ المزيد في شروط الاستخدام.