OPEN-SOURCE SCRIPT
Sri Yantra-Scret Geometry - AYNET
Explanation of the Script
Inputs:
periods: Number of bars used for calculating the moving average and standard deviation.
yloc: Chooses the display location (above or below the bars).
Moving Average and Standard Deviation:
ma: Moving average of the close price for the specified period.
std: Standard deviation, used to set the range for the Sri Yantra triangle points.
Triangle Points:
p1, p2, and p3 are the points for constructing the triangle, with p1 and p2 set at two standard deviations above and below the moving average, and p3 at the moving average itself.
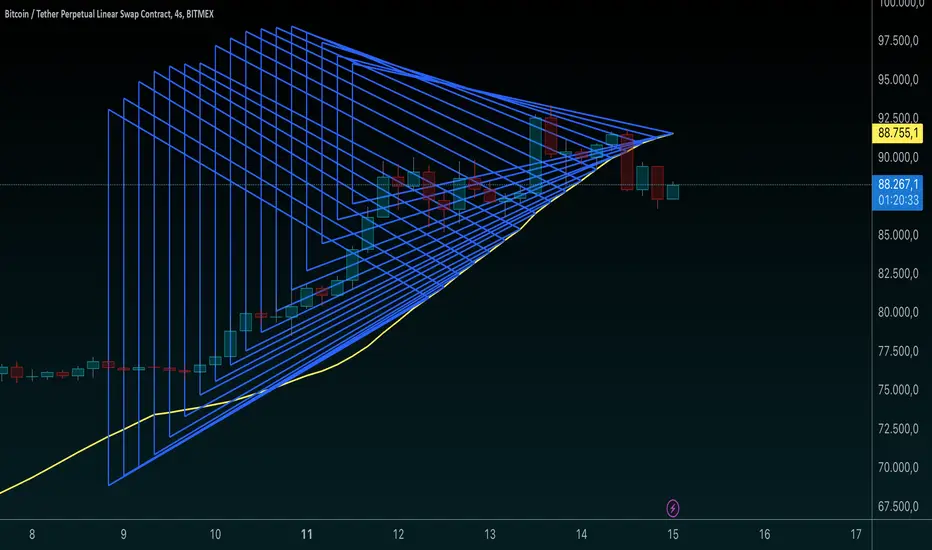
Sri Yantra Triangle Drawing:
Three lines form a triangle, with the moving average line serving as the midpoint anchor.
The triangle pattern shifts across bars as new moving average values are calculated.
Moving Average Plot:
The moving average is plotted in red for visual reference against the triangle pattern.
This basic script emulates the Sri Yantra pattern using price data, creating a spiritual and aesthetic overlay on price charts, ideal for users looking to incorporate sacred geometry into their technical analysis.
Inputs:
periods: Number of bars used for calculating the moving average and standard deviation.
yloc: Chooses the display location (above or below the bars).
Moving Average and Standard Deviation:
ma: Moving average of the close price for the specified period.
std: Standard deviation, used to set the range for the Sri Yantra triangle points.
Triangle Points:
p1, p2, and p3 are the points for constructing the triangle, with p1 and p2 set at two standard deviations above and below the moving average, and p3 at the moving average itself.
Sri Yantra Triangle Drawing:
Three lines form a triangle, with the moving average line serving as the midpoint anchor.
The triangle pattern shifts across bars as new moving average values are calculated.
Moving Average Plot:
The moving average is plotted in red for visual reference against the triangle pattern.
This basic script emulates the Sri Yantra pattern using price data, creating a spiritual and aesthetic overlay on price charts, ideal for users looking to incorporate sacred geometry into their technical analysis.
نص برمجي مفتوح المصدر
بروح TradingView الحقيقية، قام مبتكر هذا النص البرمجي بجعله مفتوح المصدر، بحيث يمكن للمتداولين مراجعة وظائفه والتحقق منها. شكرا للمؤلف! بينما يمكنك استخدامه مجانًا، تذكر أن إعادة نشر الكود يخضع لقواعد الموقع الخاصة بنا.
إخلاء المسؤولية
لا يُقصد بالمعلومات والمنشورات أن تكون، أو تشكل، أي نصيحة مالية أو استثمارية أو تجارية أو أنواع أخرى من النصائح أو التوصيات المقدمة أو المعتمدة من TradingView. اقرأ المزيد في شروط الاستخدام.