PROTECTED SOURCE SCRIPT
10Y - 2Y Spread (Farbig)
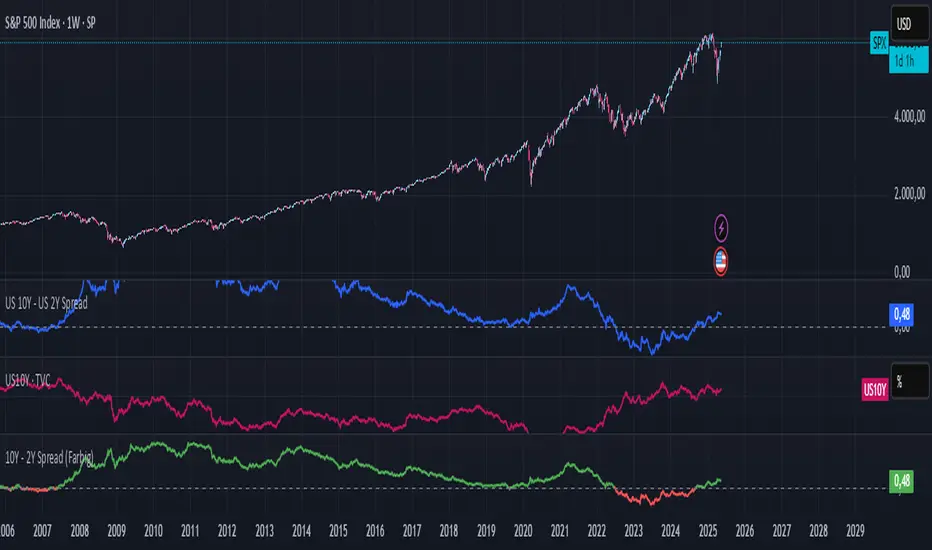
10Y – 2Y Yield Spread (Color-Coded)
Description:
This indicator plots the yield spread between the US 10-Year and 2-Year Treasury yields (US10Y – US02Y) as a color-coded line:
Green = normal yield curve (positive spread)
Red = inverted yield curve (negative spread), often seen as a leading recession signal
A horizontal zero line is added to highlight turning points.
This indicator is ideal for tracking macroeconomic yield curve behavior and can be used alongside equity, crypto, or commodity charts.
نص برمجي محمي
تم نشر هذا النص البرمجي كمصدر مغلق. ومع ذلك، يمكنك استخدامه بحرية ودون أي قيود - تعرف على المزيد هنا.
إخلاء المسؤولية
لا يُقصد بالمعلومات والمنشورات أن تكون، أو تشكل، أي نصيحة مالية أو استثمارية أو تجارية أو أنواع أخرى من النصائح أو التوصيات المقدمة أو المعتمدة من TradingView. اقرأ المزيد في شروط الاستخدام.