OPEN-SOURCE SCRIPT
Duong_Sideway Zone

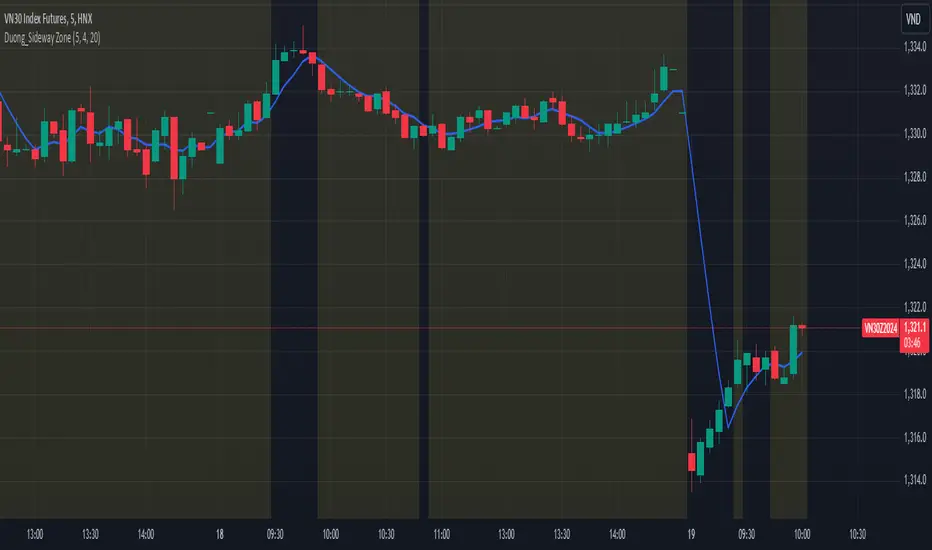
This indicator is designed to identify sideway (ranging) zones on the price chart. It uses a Moving Average (MA) and criteria such as the number of price crosses over the MA, as well as breakout checks, to determine whether the market is in a sideway state. When a sideway zone is detected, it is highlighted with a yellow background on the chart.
Key Features:
MA Line: Uses a Moving Average (MA) as the basis for trend identification.
Sideway Threshold: Based on the number of price crosses over the MA within a specific period.
Breakout Check: Excludes zones from being considered sideway if a breakout occurs beyond the ATR threshold.
Visual Highlighting: Highlights sideway zones with a yellow background for easy identification.
This indicator is ideal for traders looking to identify ranging market phases to adjust their trading strategies accordingly.
For example, if within the last 20 candles, the number of times the closing price crosses the MA5 is greater than 4, it is considered a sideway zone, except in cases where the closing price of a recent candle has broken out of the highest/ lowest price of the previous 20 candles.
نص برمجي مفتوح المصدر
بروح TradingView الحقيقية، قام مبتكر هذا النص البرمجي بجعله مفتوح المصدر، بحيث يمكن للمتداولين مراجعة وظائفه والتحقق منها. شكرا للمؤلف! بينما يمكنك استخدامه مجانًا، تذكر أن إعادة نشر الكود يخضع لقواعد الموقع الخاصة بنا.
إخلاء المسؤولية
لا يُقصد بالمعلومات والمنشورات أن تكون، أو تشكل، أي نصيحة مالية أو استثمارية أو تجارية أو أنواع أخرى من النصائح أو التوصيات المقدمة أو المعتمدة من TradingView. اقرأ المزيد في شروط الاستخدام.